

From Data Tables to Meaningful Charts: An Introductory Course on Data Visualization
Have you ever seen an infographic that was beautiful, but didn’t have a clear message?
Or wade through a bunch of tables but struggle to see any meaningful patterns and trends?
Ever see a chart you thought was terrible, but couldn’t figure out how to fix it?
Data visualizations are key to disseminating DHS survey results. Whether it’s through charts and maps in print reports, interactive graphs on STATcompiler or the mobile app, or infographics on our social media channels, DHS staff are always hard at work figuring out how best to communicate our results through clear and compelling visualizations.
In recent years, we have noticed an increased demand for data visualization assistance in the field. Our implementing agencies, journalists, and data use partners in Africa and Asia are asking: “How do we visualize our census data?”, “How do you know which kind of chart to use for that indicator?”; and “How can we show these data in an accessible infographic?”.
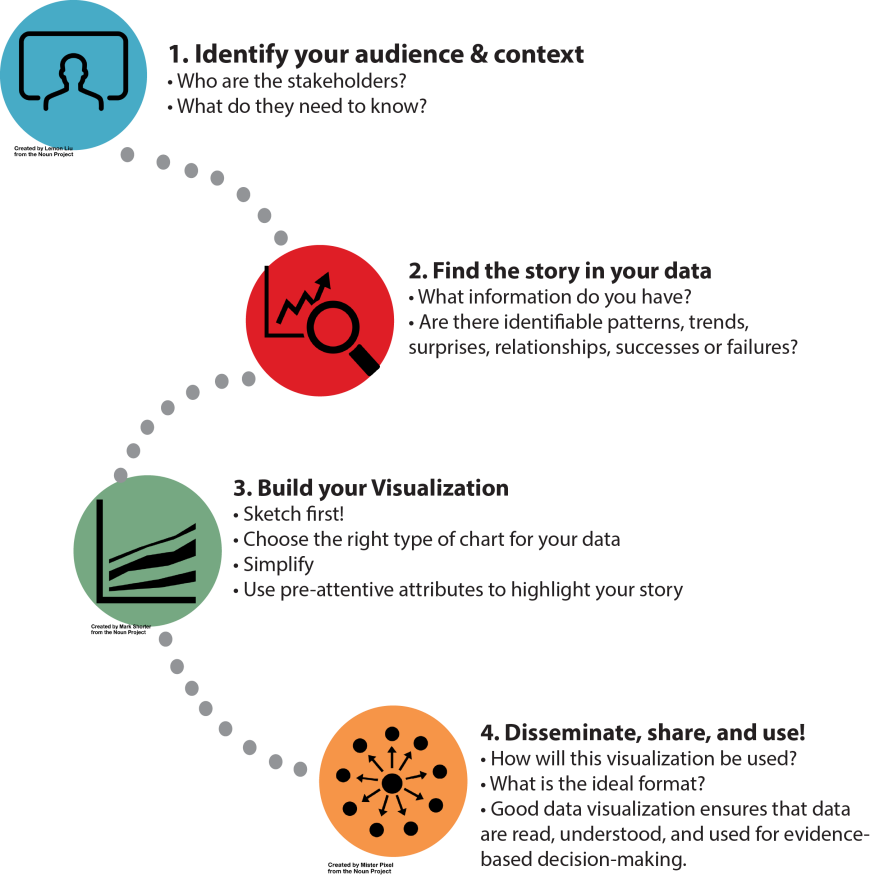
Towards that end, DHS staff have contributed to the Global Health eLearning Center’s recently released introductory course on data visualization. This course tackles a lot of strategic and practical information in a 4 step process: identifying
your audience and their context, finding the story in your data, building your visualization, and dissemination and use.
The course pulls from the current expertise in data visualization, from Edward Tufte to Stephanie Evergreen, but repackages it with a global health perspective and with a beginning learner in mind. Global health projects worldwide are expected to make data-driven decisions, to monitor and evaluate their progress, and to report successes to governments and funding agencies. Basic data visualization skills can enhance individual’s and organizations’ abilities to analyze and present their data, leading ultimately to better data use and more efficient global health programming.
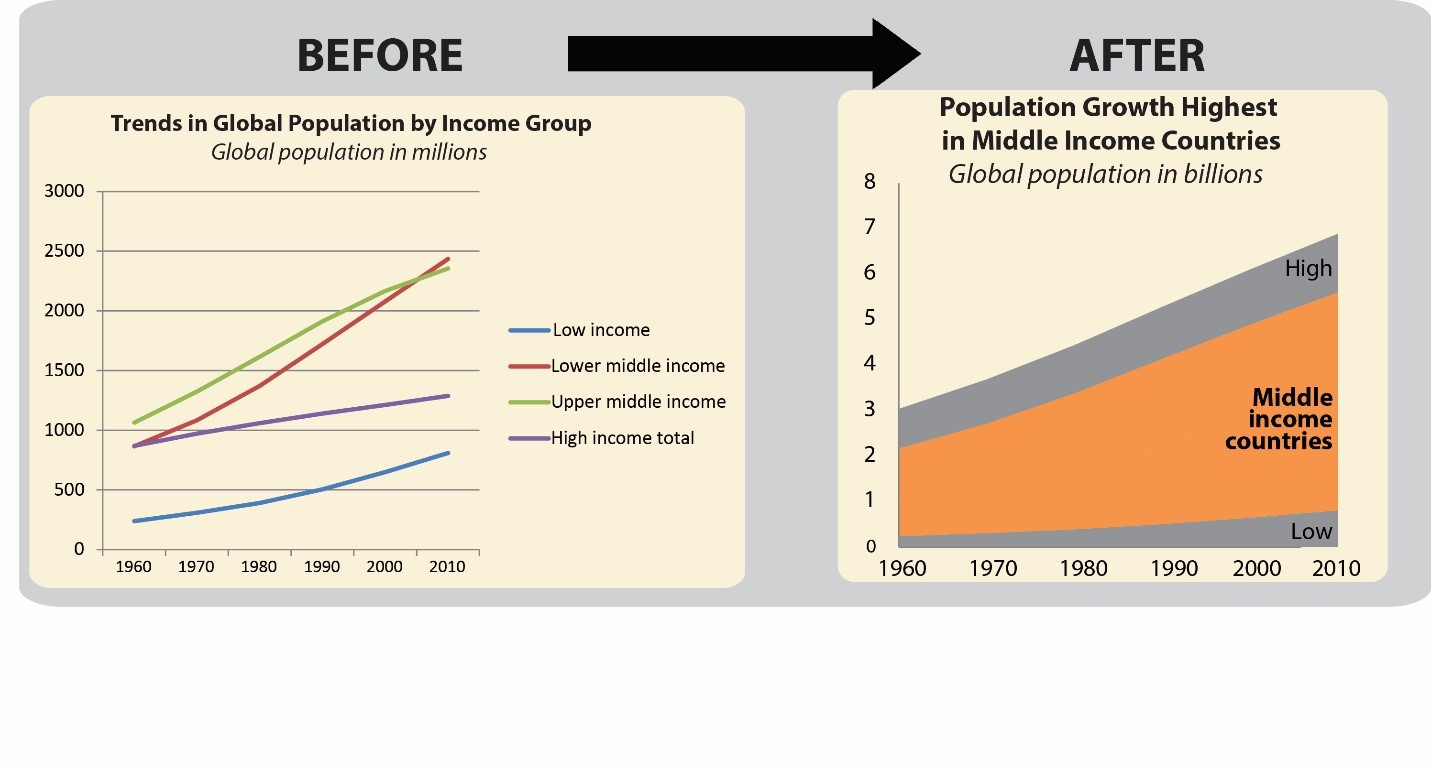
Through a realistic case study and a set of commonly used World Bank population indicators, the course introduces concepts such as numeracy, drafting data headlines, smart use of preattentive attributes, matching data stories to the appropriate graph type, and working with a diverse team of experts to develop more complex visualizations such as infographics, maps, and data dashboards.
This basic principles covered in this data visualization eLearning course have also inspired a one day in-person data visualization workshop that DHS staff will be offering in a DHS country for the first later this year. The course is full of hands-on data visualization activities, and participants will leave with practical tools and draft visualizations that they can use in their everyday work.
Want to see great examples of data visualization in global health or browse some great data viz tips? Follow the DataVizHub blog!

Thank you for the Good NEWS, It is badly needed