Category Archives: Data Viz

16 Days of Activism against Gender-based Violence

Written by: The DHS Program

02 Dec, 2019

The 16 Days of Activism against Gender-based Violence campaign is back in action for 2019 under the theme “Orange the World: Generation Equality Stands against Rape!” This year, The DHS Program is highlighting sexual and physical violence indicators, as well as help seeking behavior in Tajikistan, Pakistan, Nigeria, Benin, and Mali. Click on a graph […]


Global Goals Week 2019

Written by: The DHS Program

24 Sep, 2019

Global Goals Week is back with a full week of action, awareness, and accountability for the Sustainable Development Goals (SDGs), also known as the Global Goals. The Demographic and Health Surveys (DHS) Program collects demographic and health indicators to calculate approximately 30 of the indicators supporting the SDGs. These indicators and more can be found […]


International Women’s Day 2019

Written by: The DHS Program

08 Mar, 2019

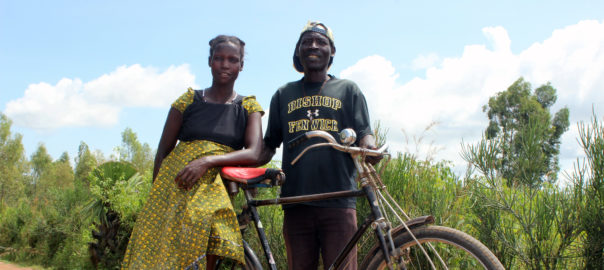
© 2016 Kato James, Courtesy of Photoshare The DHS Program is now in its 35th year with a long history of helping to collect, analyze, and disseminate data on women’s empowerment, gender equality, men’s engagement, and gender-based violence within the context of health and development. Historically, The DHS Program has integrated attention to gender in […]


16 Days of Activism against Gender-based Violence

Written by: The DHS Program

03 Dec, 2018

We are halfway through the 16 days of Activism against Gender-based Violence, but there is still time to get involved. The DHS Program has a variety of resources to help you learn about the prevalence of violence against women around the world. Since 2000, The DHS Program has collected domestic violence data in more than 50 countries. Explore […]


World Population Day 2018

Written by: The DHS Program

11 Jul, 2018

It’s that time of the year again, and we’re back with another World Population Day #PopPyramid Quiz! Population pyramids are great ways to visualize a country’s distribution of various age groups in a population by sex. We also created an infographic with population pyramids from recent Demographic and Health Surveys (DHS). Scroll down below the […]


A New Way to Interact with your Favorite Indicators

Written by: The DHS Program

22 Feb, 2018

We are pleased to showcase a new mini-tool on our website that allows you to quickly interact with indicators for topics such as family planning, gender, malaria, and nutrition. We have preselected 10-15 key indicators per topic that you can view by country or globally. Family Planning Gender Malaria Nutrition Simply navigate to your favorite topic to see […]


Enfin, STATcompiler et l’Appli Mobile du DHS Program disponibles en français

Written by: The DHS Program

02 Nov, 2016

L’attente est finie! Le STATcompiler et l’Appli Mobile du DHS Program sont désormais disponibles en français.  Saviez-vous que 30 % des enquêtes du DHS Program sont réalisées dans pays francophones ? Notre objectif est d’augmenter l’utilisation de nos données par nos collègues francophones.  Ces deux outils placent plus de 250 enquêtes de 90+ pays au bout de […]


How Many Demographers Does It Take to Make a Great Visualization?

Written by: Erica Nybro

13 Apr, 2016

How much time do you budget to create a data visualization?  The best visualizations, though they appear to be simple and clear, are often the result of dozens of attempts. Demographers spend countless hours crunching data and preparing journal submissions, but not all take full advantage of data visualization, either in their exploratory analysis, or […]