Family Planning Data Highlighted in First DHS Program Tableau Dashboard
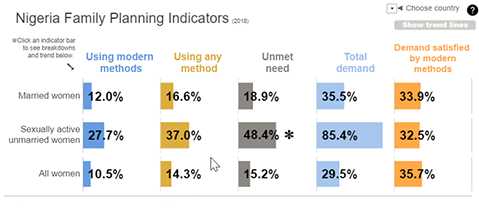
Did you know that almost half of sexually active unmarried women in Nigeria age 15-49 have an unmet need for family planning, compared with only 19% of married women? Or that unmet need among sexually active unmarried women is lowest in Peru, at only 6%? These are the types of patterns and trends that jump off the screen in The DHS Program’s new family planning Tableau dashboard.
The DHS Program’s first Tableau dashboard visualizes 5 key family planning indicators in 58 countries. Users can explore global patterns and trends or deep dive into data from a single country.
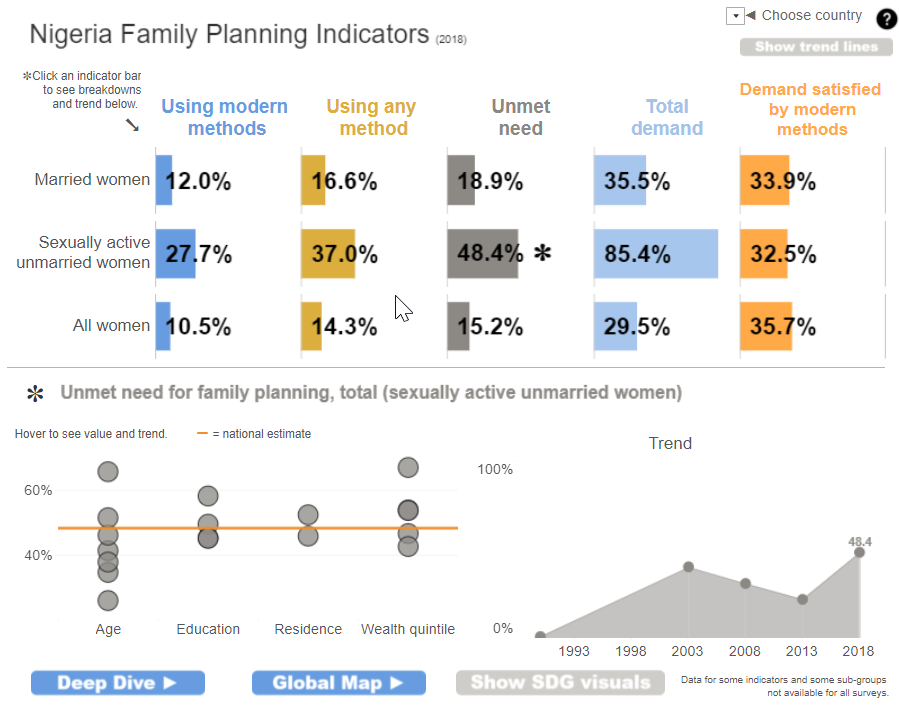
The first view presents 5 family planning indicators for 3 groups of women (married women, sexually active unmarried women, and all women). Users can see at a glance how these indicators compare across these 3 groups of women, by background characteristics, and over time.
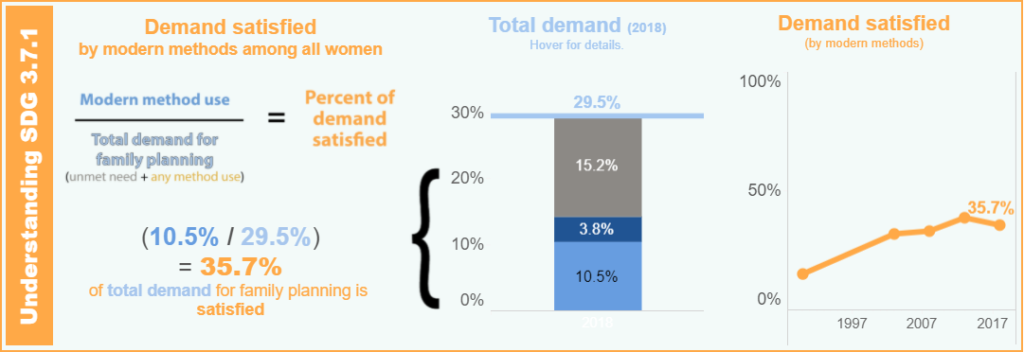
The “SDG visuals” option visualizes the more complex “demand satisfied by modern methods” indicator.
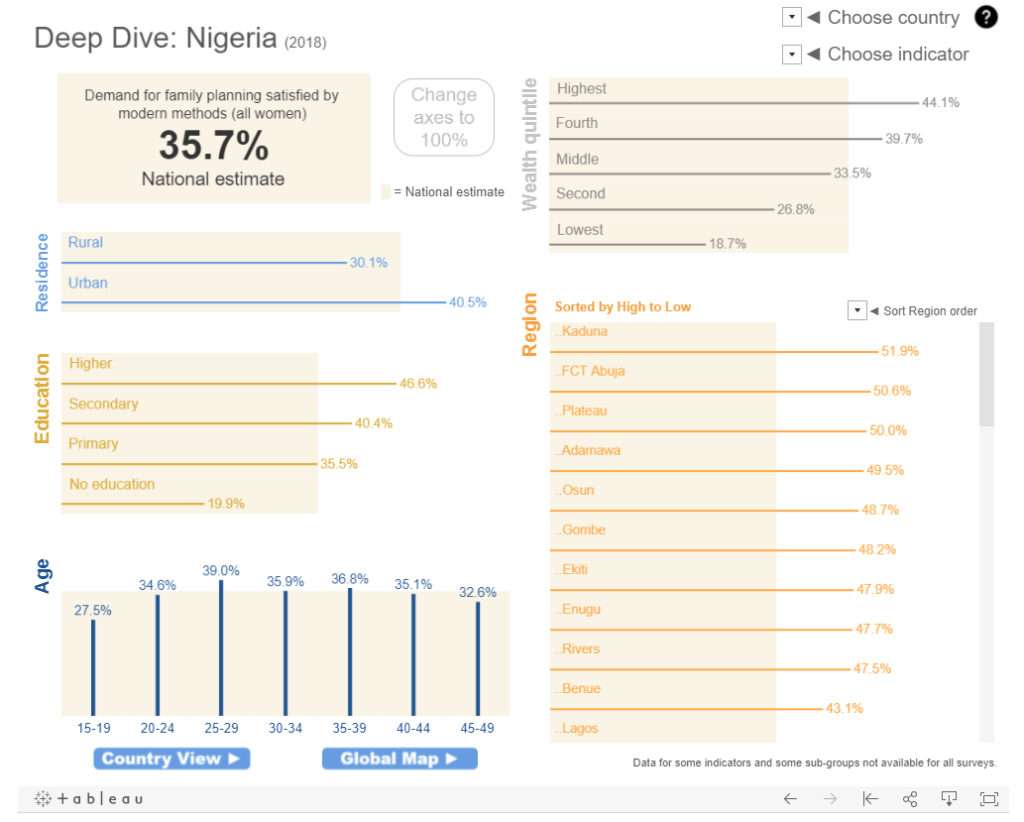
The “deep dive” presents the individual country data by 5 background characteristics (residence, education, age, wealth quintile, and subnational region).
In the global map view, users can see the range of any selected indicator across 58 recent DHS Program countries.
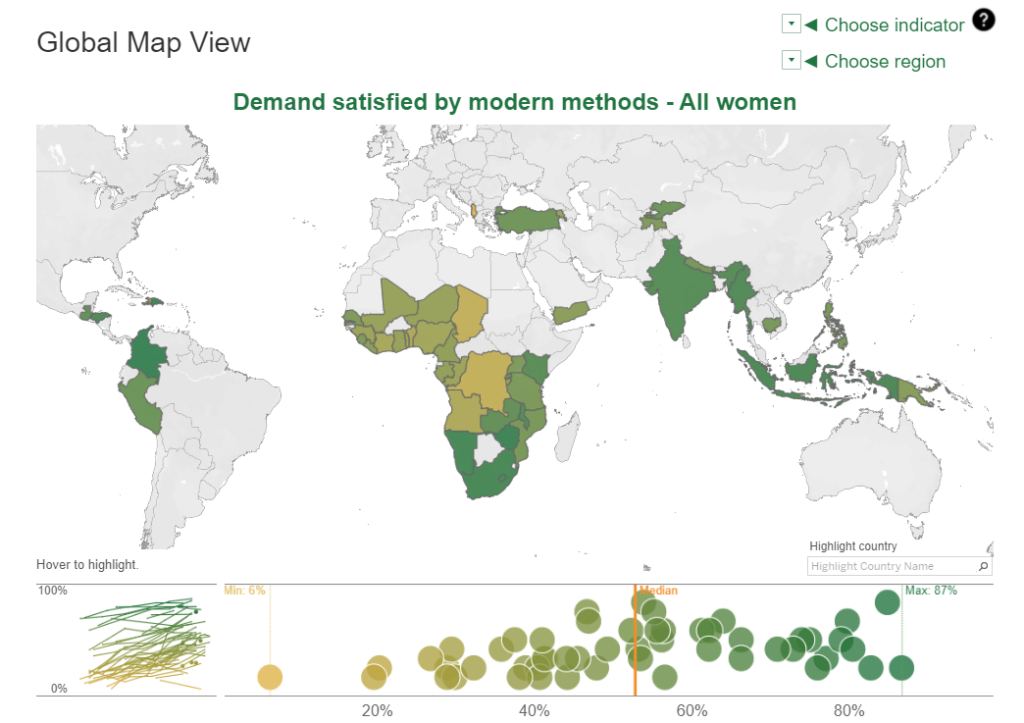
If you are brand new to Tableau, have no fear. Just click on the “?” icon and basic instructions will overlay your view.
Already a Tableau expert? Try visualizing DHS Program indicator data through The DHS Program’s Application Programming Interface (API) and look for guidance on connecting to The DHS Program’s API through Tableau coming soon.
