Gender Dashboard: Explore DHS Gender-related Data Across a Wide Range of Indicators
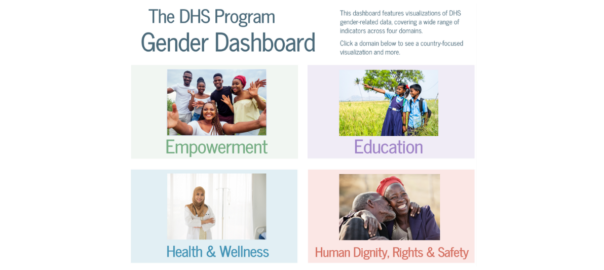
Since 1984, The DHS Program has been a important resource for examining gender in survey countries. Together with our implementing partners, the project has expanded the breadth of publicly available high-quality gender data, starting with the addition of women’s employment questions in 1988. Questions on maternal mortality and female genital cutting were introduced in 1989, followed by the first questions on spousal violence in 1990. A full module on women’s status debuted in 1994. Questions on women’s experience of intimate partner violence were introduced in 1998 and formed the basis of domestic violence module introduced in 2000. The inclusion of HIV testing in 2001 revealed disparities in HIV prevalence by gender and in 2013, questions on fistula were added. But data are only useful if they are easy to access and understand. To that end, we are pleased to launch the Gender Dashboard.
Our new dashboard features visualizations of DHS gender-related data, covering a wide range of indicators across 4 domains: empowerment, education, health & wellness, and human dignity, rights, & safety.

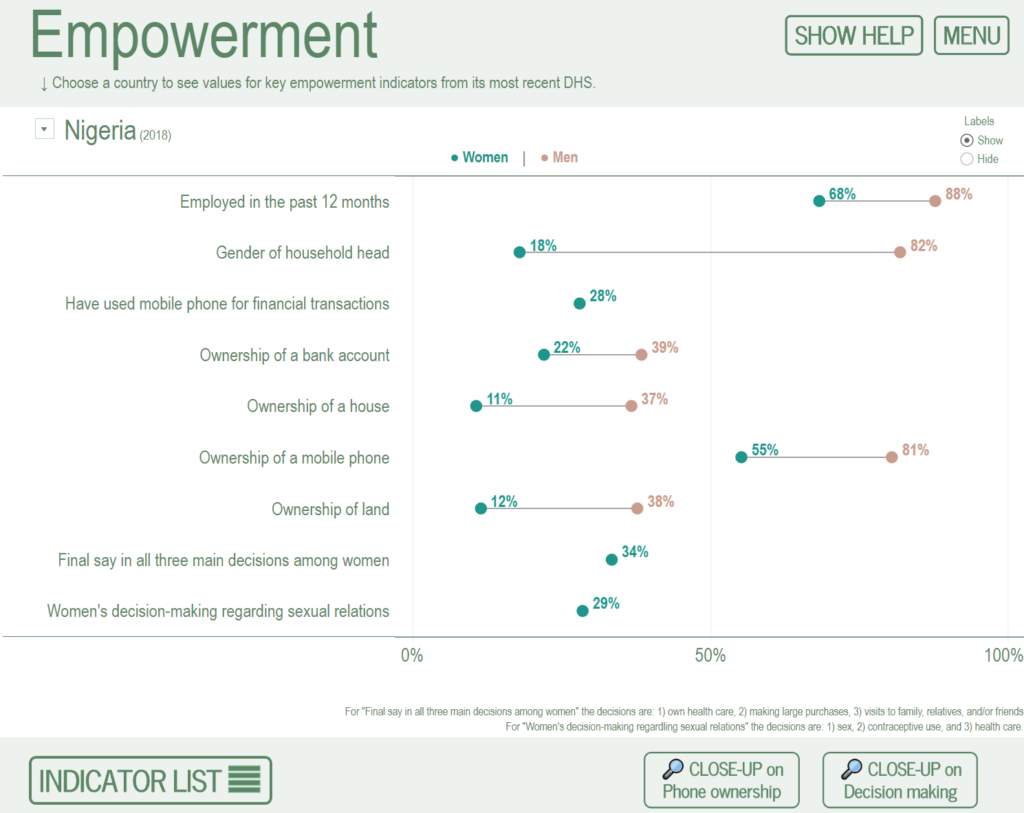
The Empowerment view displays nine indicators exploring employment, control over earnings, asset ownership, and decision-making. Each circle represents the value of the indicator for either women or men and the line connecting them visualizes the difference. Choose a country to see its most recent DHS data on empowerment.
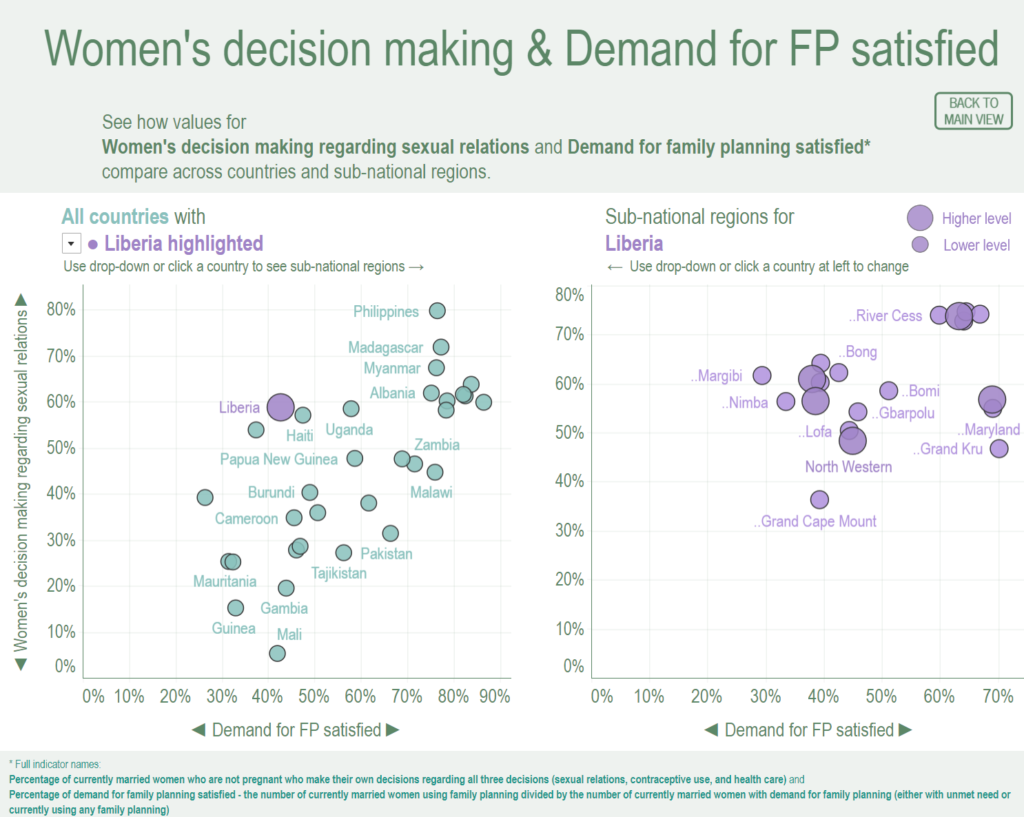
A close-up on women’s decision making regarding sexual relations and demand for family planning satisfied on the Empowerment view of our gender dashboard lets users compare these indicators across countries and look at subnational differences within a country.
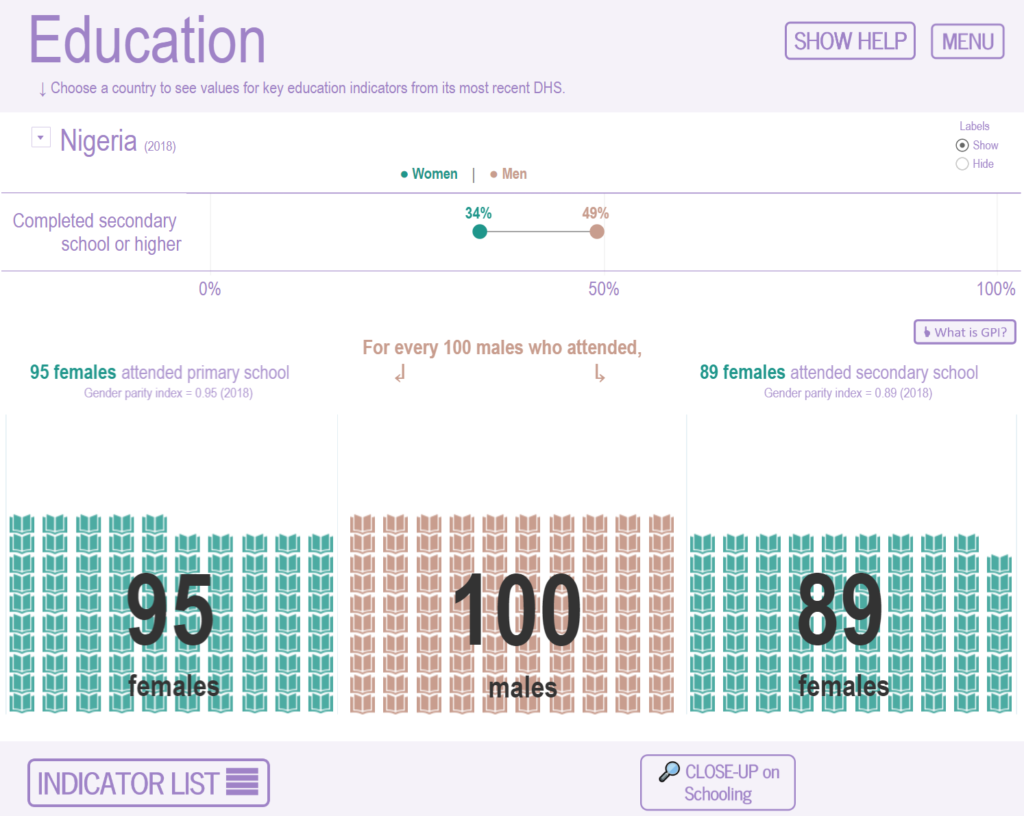
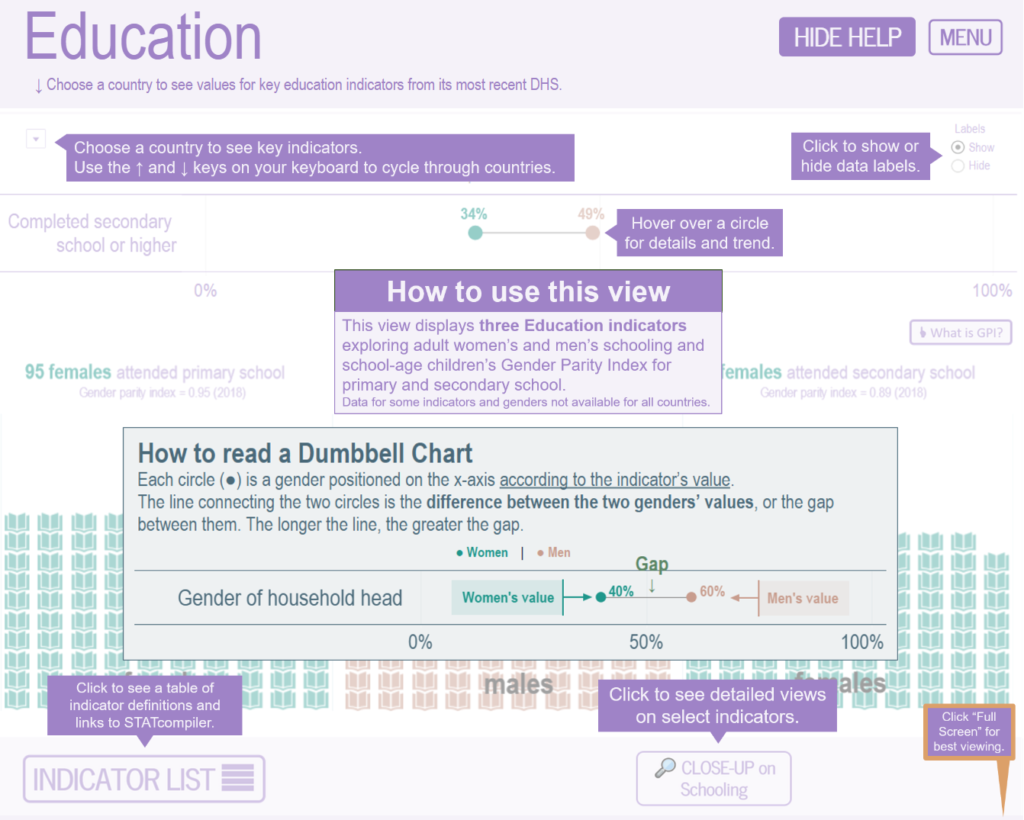
The Education view displays three indicators: adult women and men’s schooling and the gender parity index for primary and secondary school among school age children. Choose a country to see its most recent DHS data on education.
Choose ‘Show Help’ from the top right on any of the four main views to get guidance on how to use the different features in the gender dashboard.
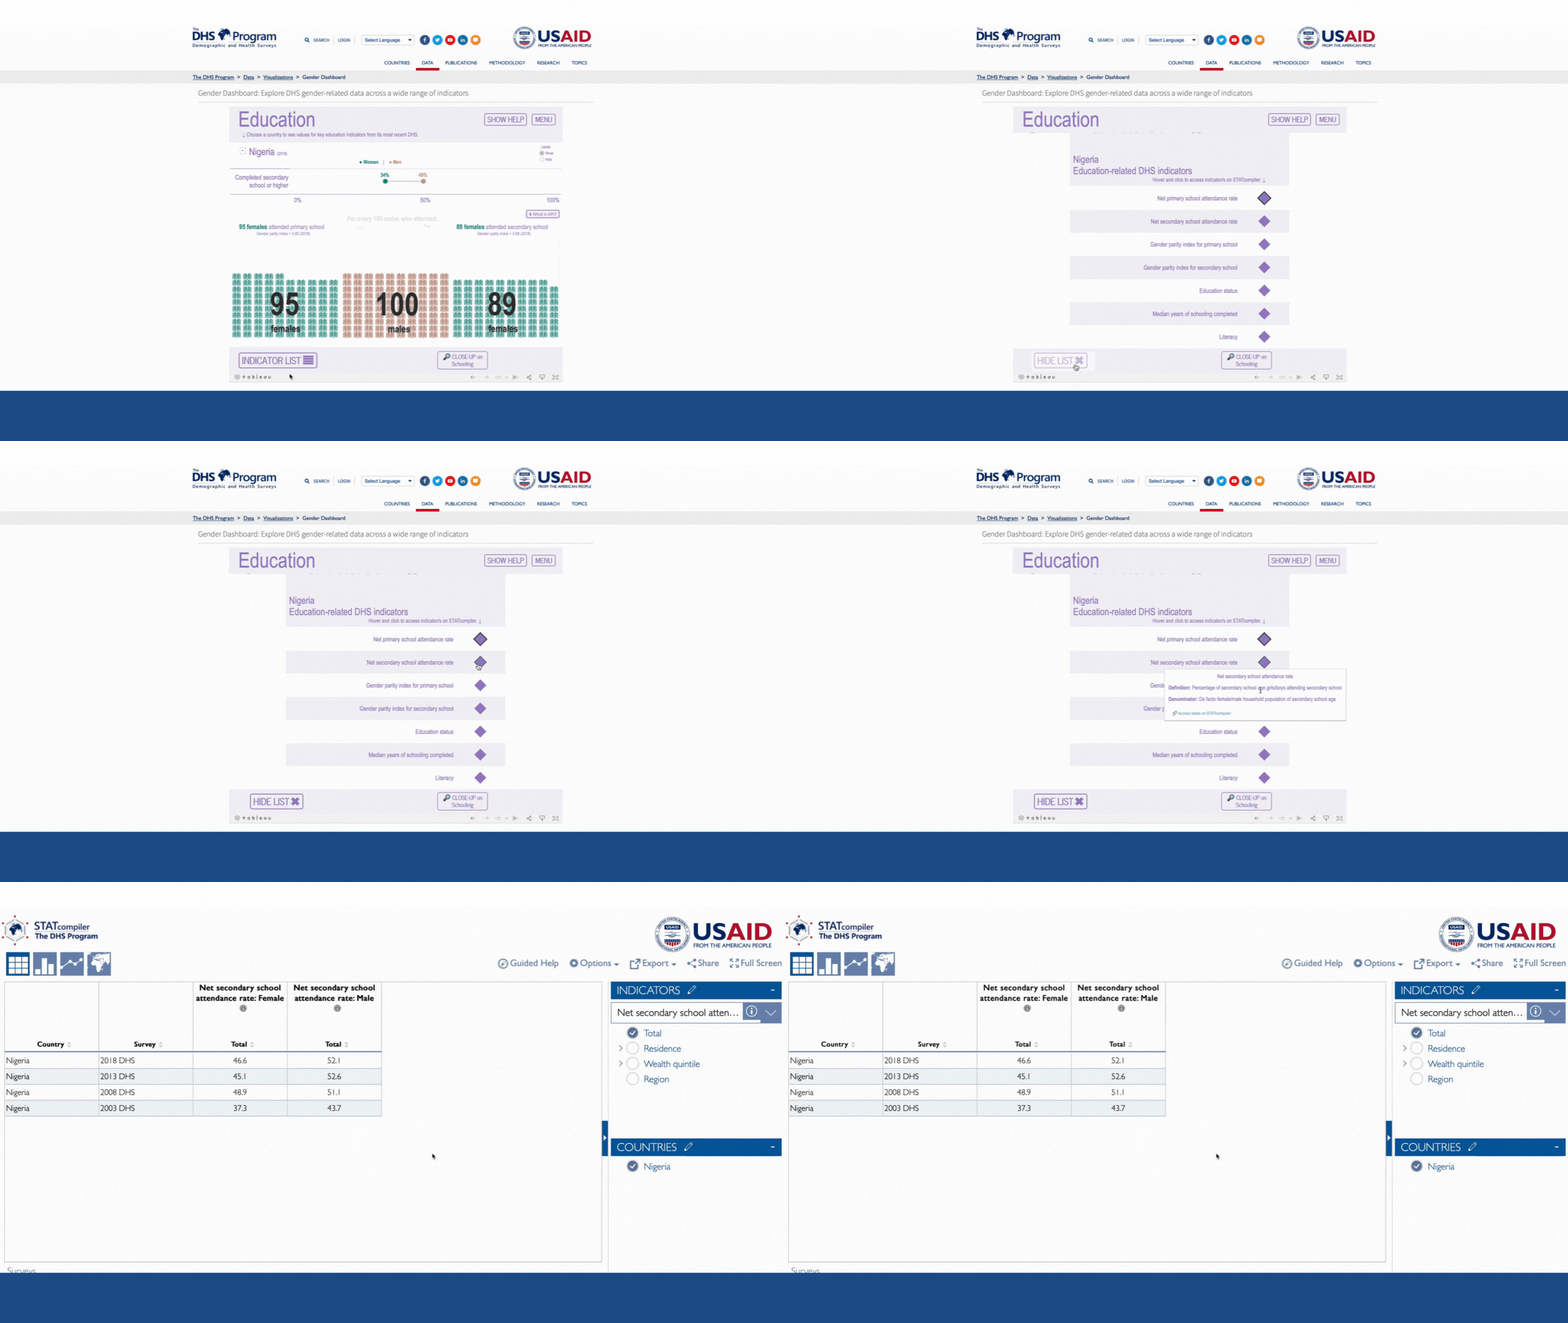
To see more available indicators on the gender dashboard, click on Indicator List. Hover on the diamond to see the indicator definition. Click on ‘access table on STATcompiler’ to open a new window with those data for your selected country.
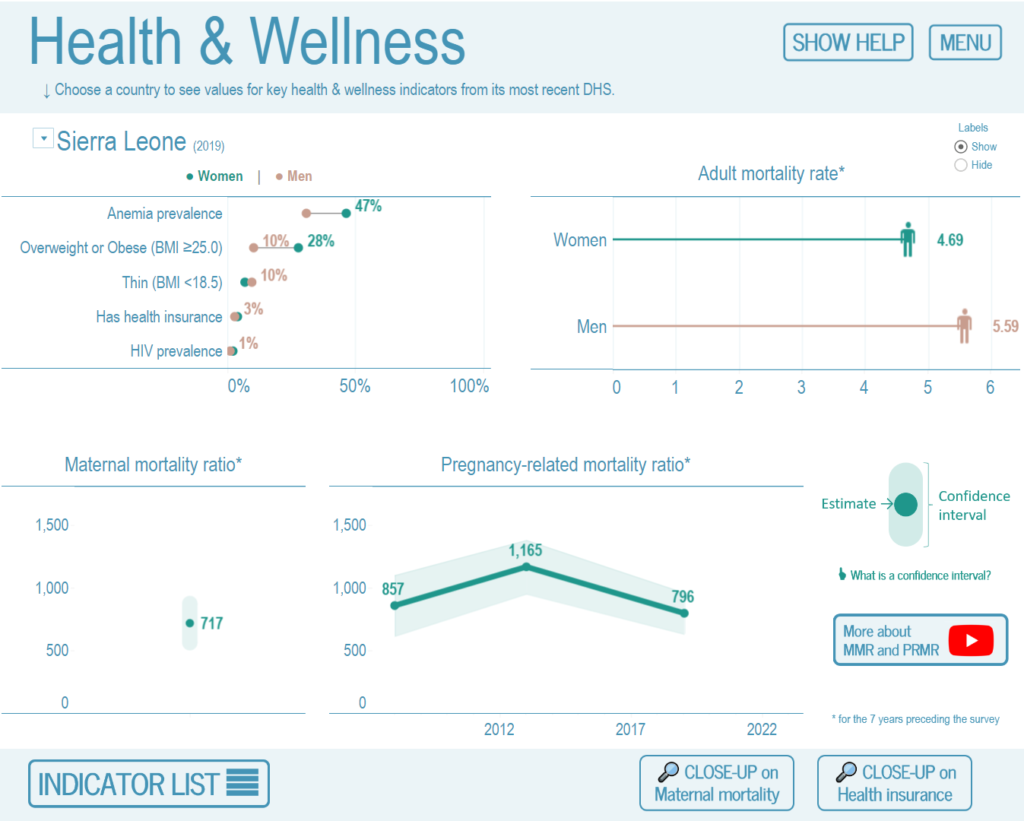
The Health & Wellness view displays eight indicators: anemia, BMI, health insurance coverage, HIV prevalence, and adult, maternal and pregnancy-related mortality. Choose a country to see its most recent DHS data on health and wellness.
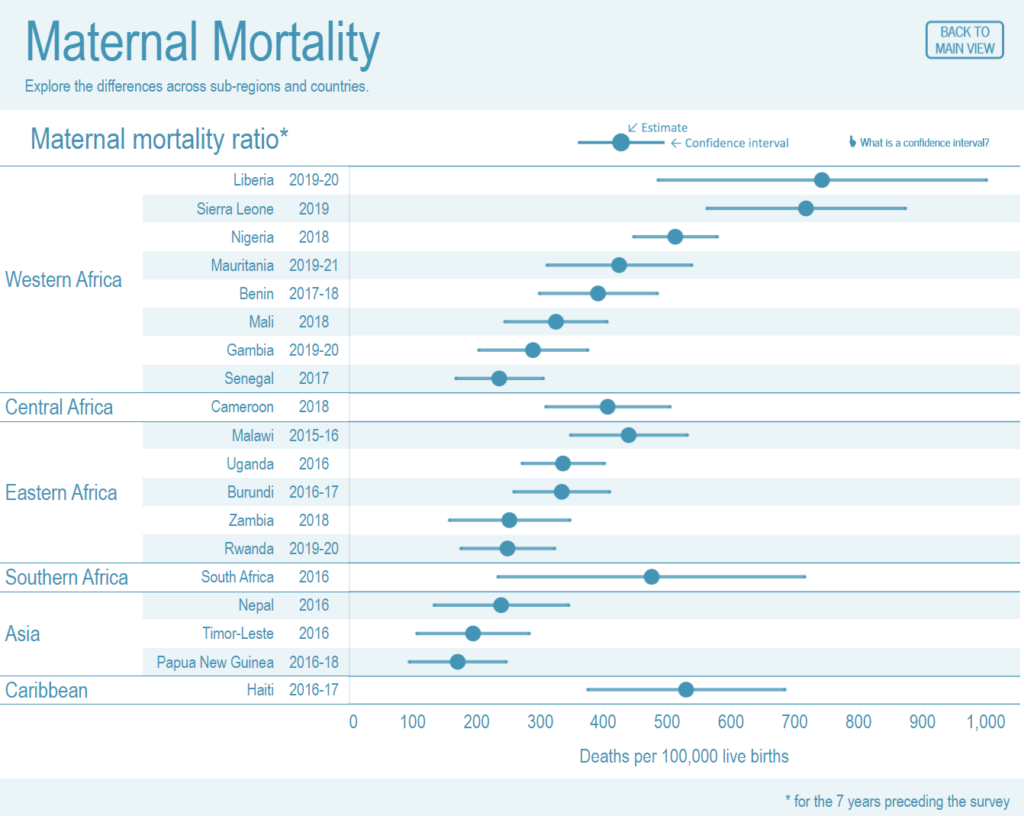
A close-up on the maternal mortality ratio on the Health & Wellness view of our gender dashboard lets users compare this SDG across countries and regions and includes the confidence interval.
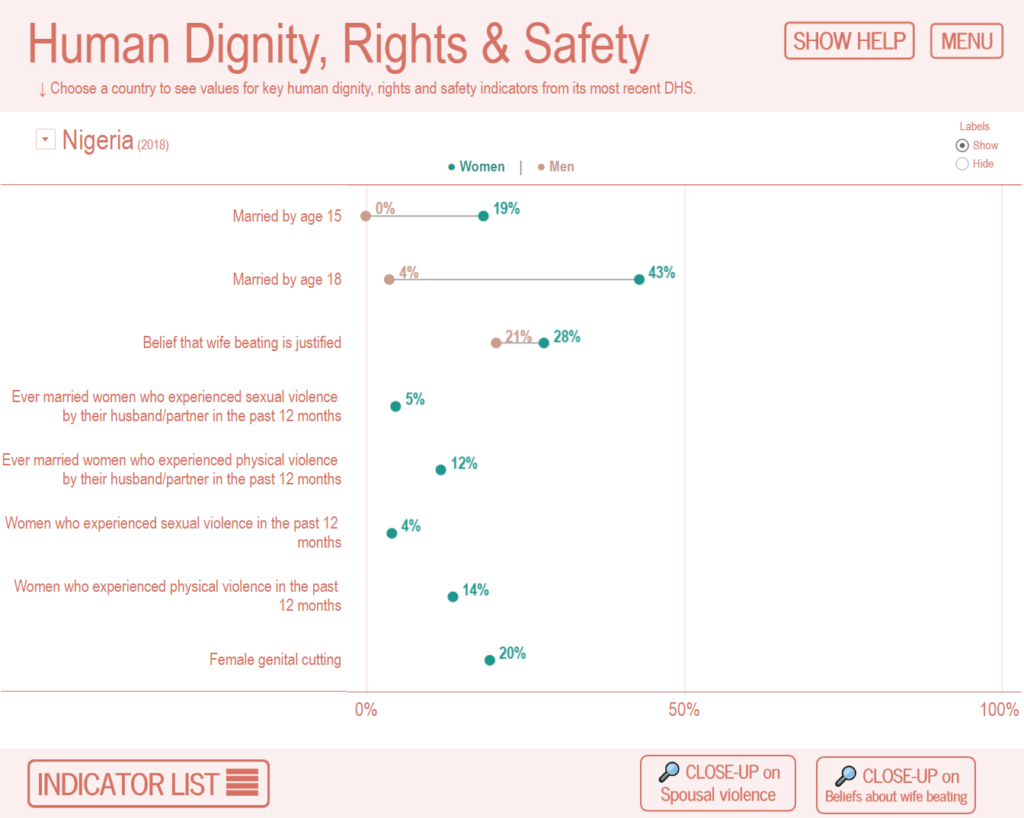
The Human Dignity, Rights & Safety view displays eight indicators exploring age of marriage, spousal violence, and female genital cutting. Choose a country to see its most recent DHS data on human dignity, rights & safety.
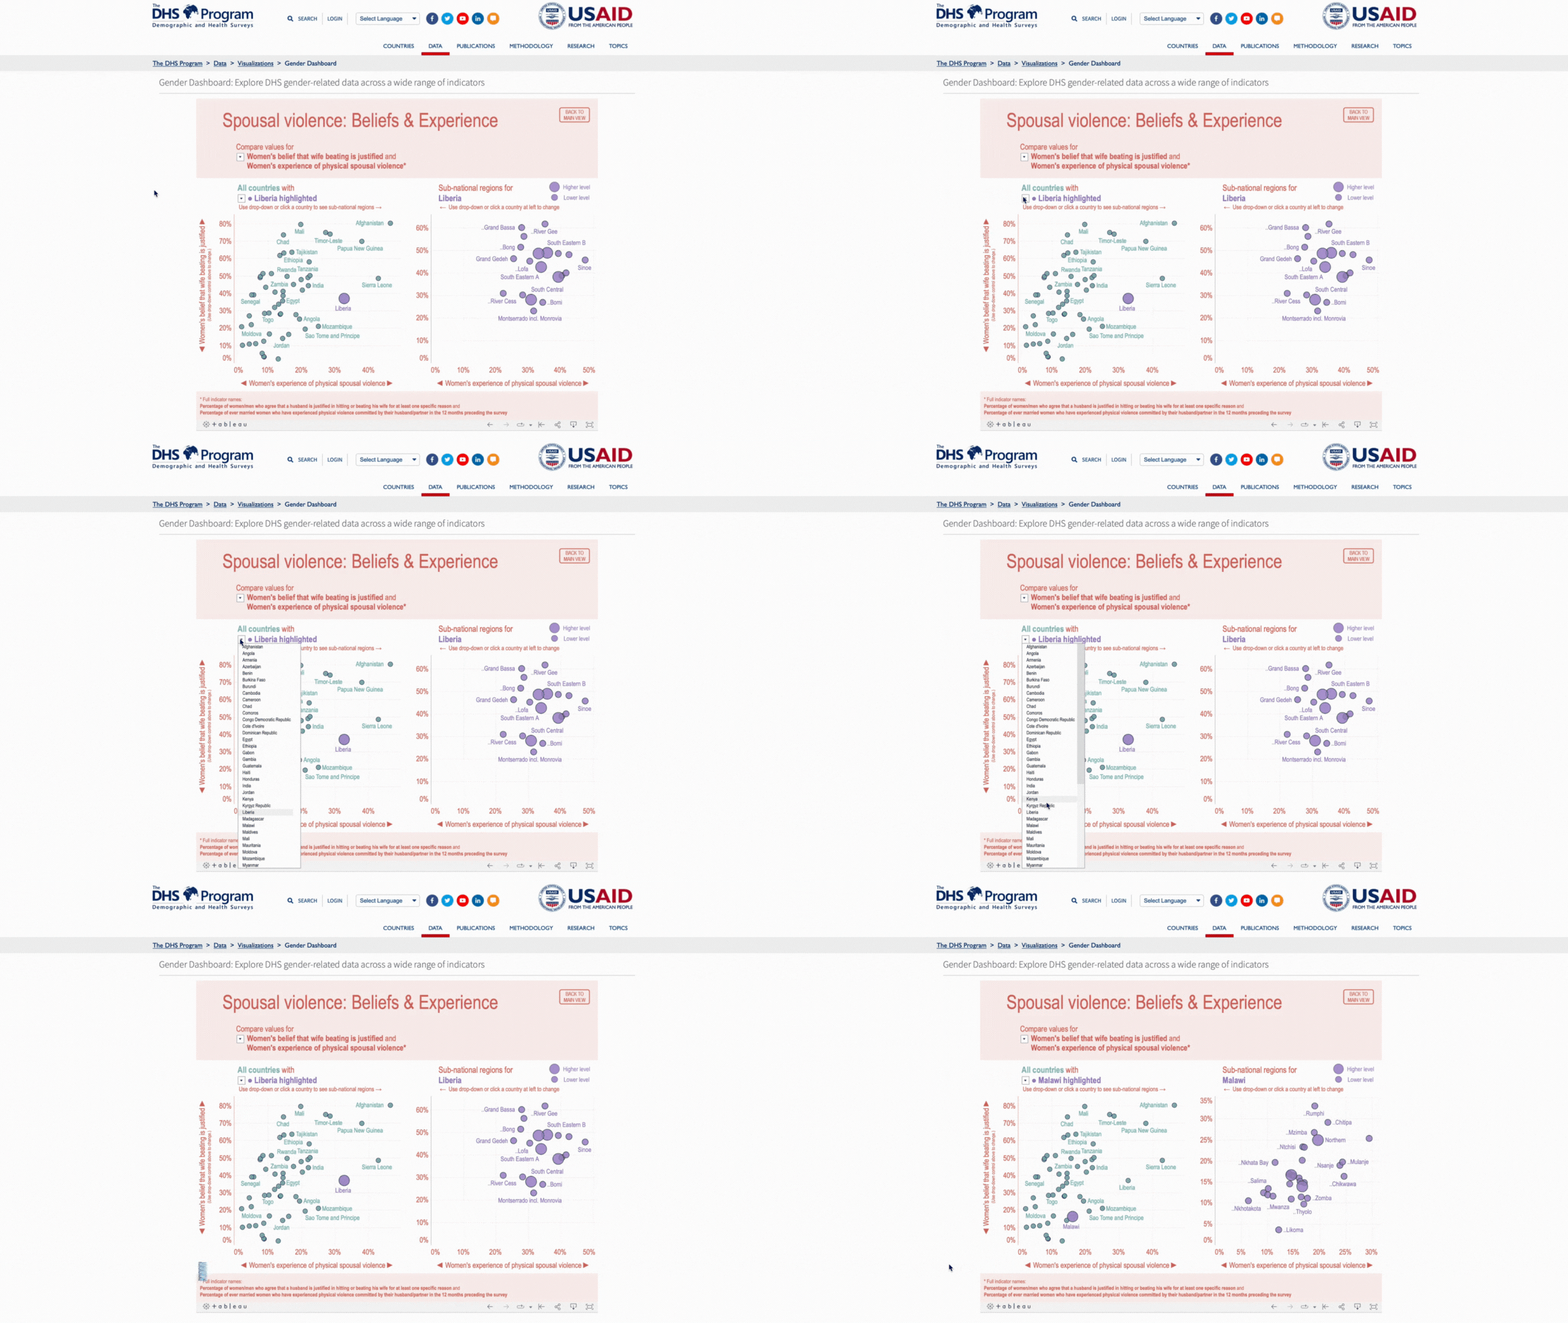
A close-up on beliefs about and experience of spousal violence on the Health & Wellness view of our gender dashboard allows users to compare these indicators across countries and explore subnational differences within a country.
Are you inspired by these visualizations? Do you have a creative way of visualizing World Fertility Survey or DHS data? Submit your visualization using WFS or DHS data and you may be featured in the data visualization showcase!

Wonderful!