

Luminare: Geospatial Modeling for Locally Available Data
This blog post is part of Luminare, our blog series exploring innovative solutions to data collection, quality assurance, biomarker measurement, data use, and further analysis.
Demographic and Health Surveys (DHS) collect nationally representative data and data representative at the first subnational administrative level (ADMIN 1). The 2016 Ethiopia DHS was designed to produce representative estimates for nine regions and two administrative cities. The 2014 Kenya DHS produced estimates for eight regions (formerly provinces). In addition to national-level indicators, STATcompiler also presents subnational data, as shown in the map of childhood stunting at the ADMIN 1 level in Ethiopia and Kenya.
Childhood Stunting by Subnational Level, 2016 Ethiopia DHS & 2014 Kenya DHS
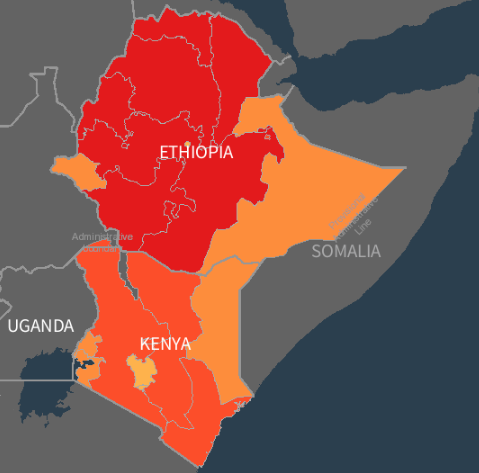
Click the map to explore childhood stunting using STATcompiler.
National and ADMIN 1 data help countries track their progress towards achieving the Sustainable Development Goals, for instance. However, as countries decentralize their health service delivery systems, local health officials increasingly need local data. In Ethiopia, nine regions are further divided into zones and special districts (ADMIN 2). In Kenya, eight regions are further divided into counties.
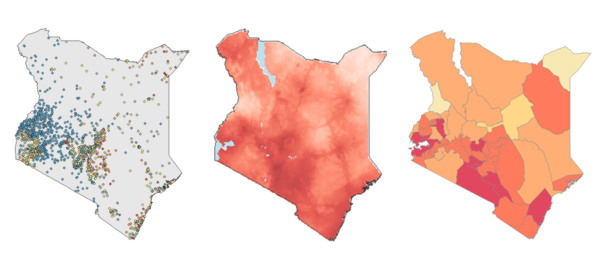
One option to get data representative at the ADMIN 2 level is to increase the survey sample size, requiring more time and more money. Another option is to produce spatially interpolated maps, which use Bayesian geospatial modeling techniques to predict indicator values at non-surveyed locations.
The DHS Program’s Geospatial team assembled data for 12 geospatial covariates, such as elevation, precipitation, and population density. These covariates are related to and can partially explain variation in health indicators of interest, allowing for more accurate predictions across the map.
Next, the Geospatial team imported georeferenced cluster data points from the 2016 Ethiopia DHS and 2014 Kenya DHS. (Did you know? You can download shapefiles or geodatabases of georeferenced data for most DHS surveys from the Spatial Data Repository.)
Using the geospatial covariates and survey data, the Geospatial team employed a new modeling approach–a stacked ensemble model–which combines multiple models. This increases predictive power and captures the potentially complex interactions and non-linear effects among the geospatial covariates. Three sub-models were fit to the health indicator data using the geospatial covariates as exploratory predictors. The prediction surfaces generated from the sub-models were then used in the final Bayesian geospatial model, producing 5 X 5 km pixel-level mean estimates of health indicators with associated uncertainty.
Childhood Stunting by 5 X 5 km Pixel, 2016 Ethiopia DHS & 2014 Kenya DHS
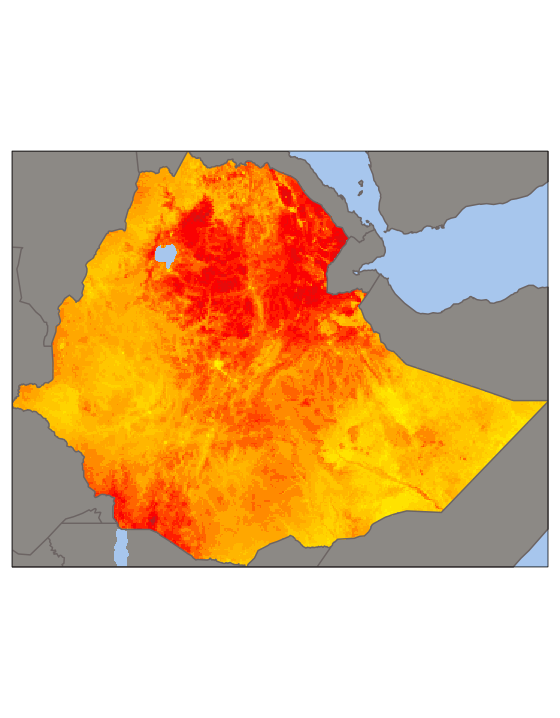
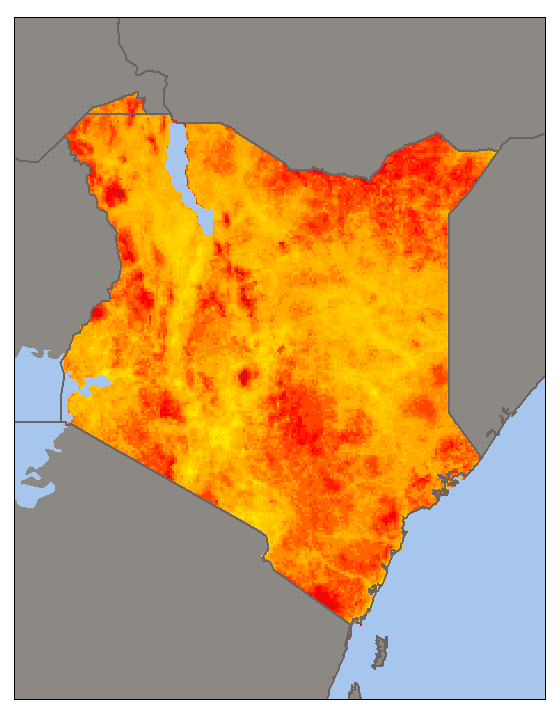
Modeled surface maps available from the Spatial Data Repository.
Pixel-level estimates were then used to calculate population-weighted averages to aggregate estimates to the ADMIN 2 level. For Ethiopia, this produced estimates of childhood stunting by zone, and in Kenya, estimates by county.
Childhood Stunting by ADMIN 2 level, 2016 Ethiopia DHS & 2014 Kenya DHS
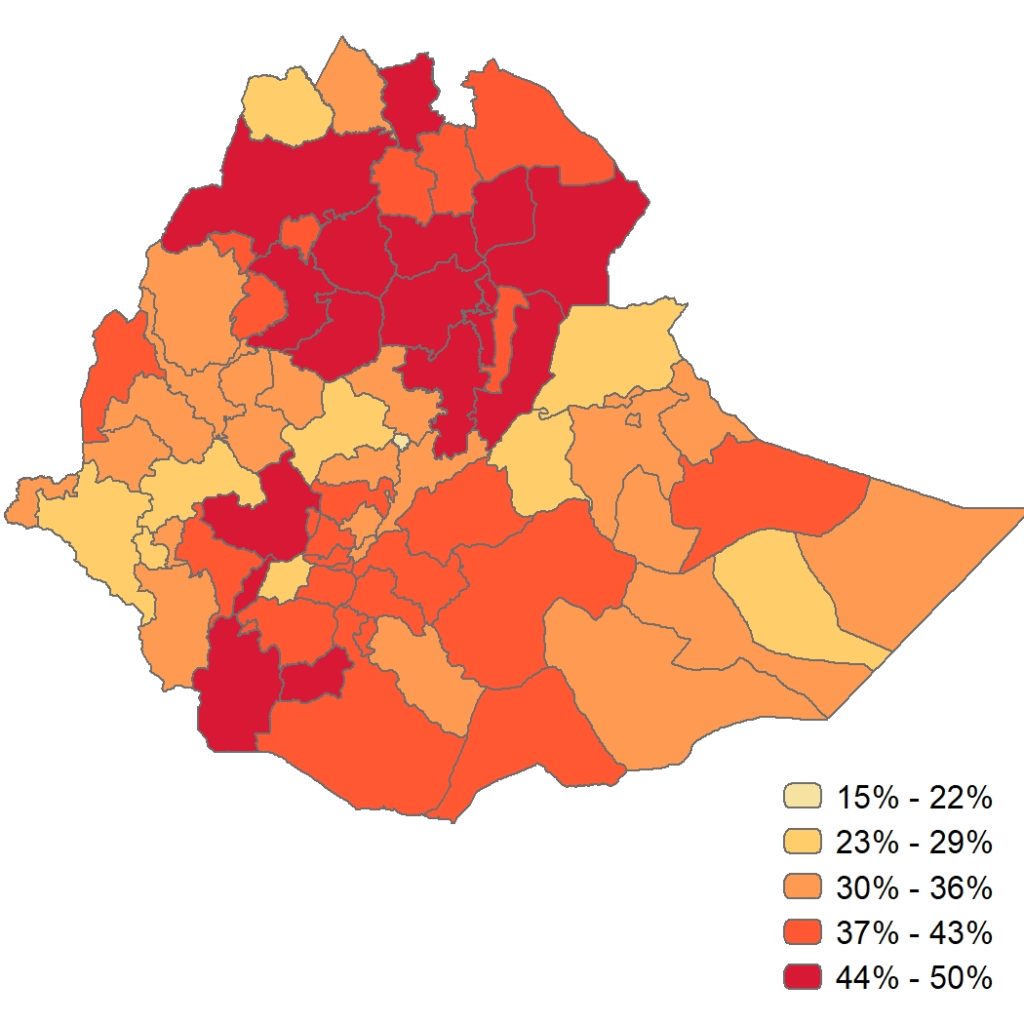
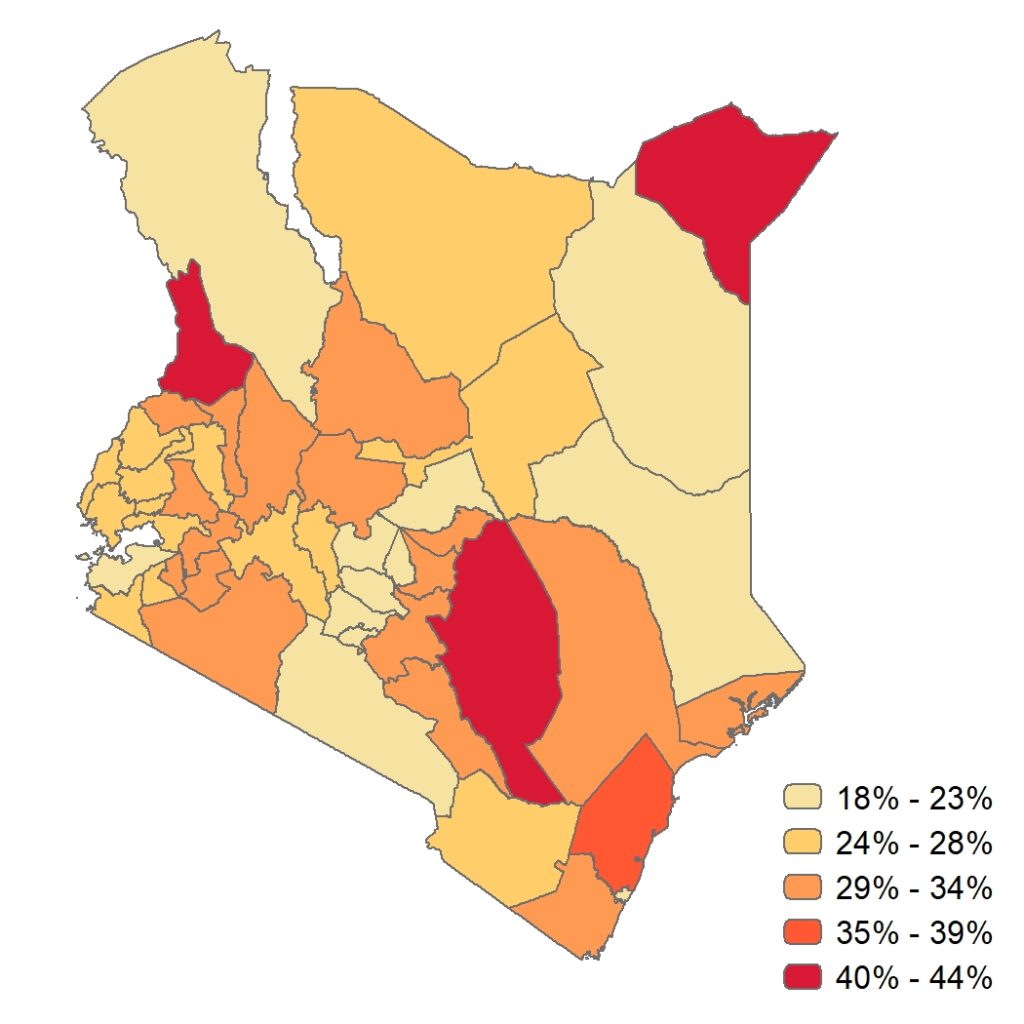
Health system program managers in Ethiopia and Kenya can now use these zonal- and county-specific estimates to make decisions and manage locally administered health programs to address childhood stunting in their areas.
The DHS Program will continue exploring model-based geostatistics as a feasible, reliable, and cost-effective way to produce local data for local needs.
Read the full report, Interpolation of DHS Survey Data at Subnational Administrative Level 2.
Explore available spatially modeled map surfaces of DHS indicators on the Spatial Data Repository.

thanks
thanksfor this
very good