
GIS Day 2015
I love maps! They are a great way to understand and visualize data, especially when you are looking to understand how place might influence certain health behaviors or outcomes. Luckily, I spend my days here at The DHS Program preparing data for maps, making maps, talking about maps, teaching others to make maps, and thinking of new ways to share maps with the whole world. The good news is that you don’t have to be a Geographic Information System (GIS) professional to appreciate or even make your own maps using DHS data.
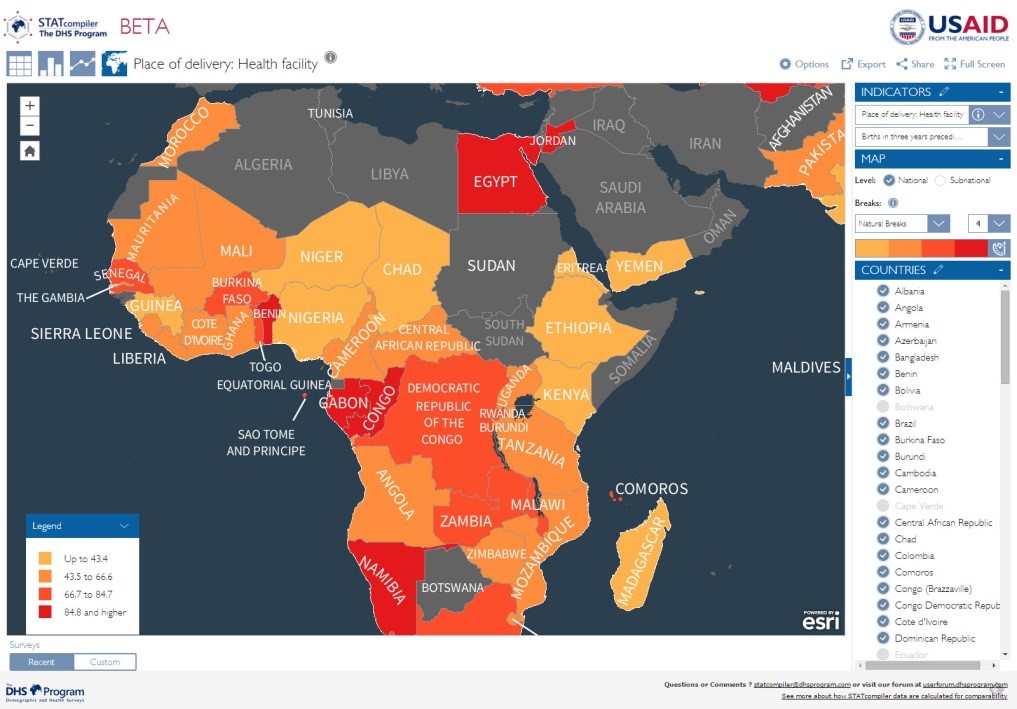
STATcompiler is a great tool that can allow you to visualize DHS data in many ways including via maps. These maps can be seen both at the national and sub-national level, and allow for various customizations including colors and number of categories.
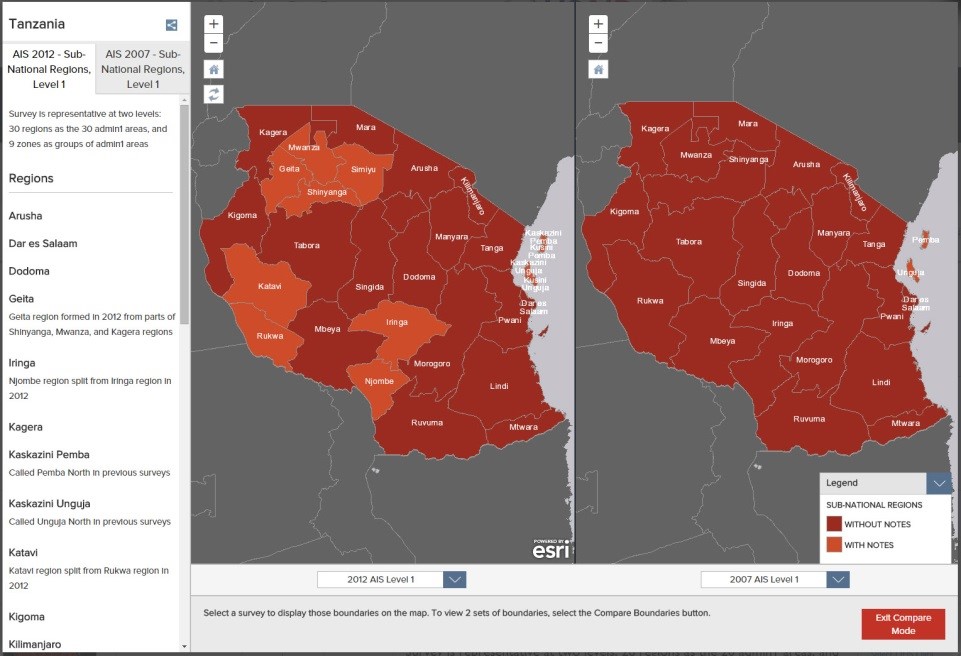 The Spatial Data Repository (SDR) is also a tool that can be used by non-GIS professionals to view maps and DHS geographic information. The boundaries page allows anyone to visualize the change in sub-national borders between various surveys. This can be very useful for analysts, survey planners, and individuals interested in sub-national trends over time.
For a full view, please visit spatialdata.dhsprogram.com/SAR12
The gallery page has maps that have been created by The DHS Program and others using DHS data. Maps located in the gallery are tagged in different ways so that you can find the topic or countries you are most interested in. These maps are created for specific reports, presentations, or other activities. Recently, we created a series of interactive maps as an online supplement to the Spatial Analysis Report 12 Report. These maps allow viewers to explore the report data more in depth and click on a country region to see more information for the indicator selected.
You too can participate in the online map gallery: create an original map using at least some DHS Program data (either downloaded from the SDR or data created using other resources), and submit the map to spatialdata@dhsprogram.com. Static maps (JPG, PDF, etc.) or interactive web maps/apps are welcome. We will review your map and if appropriate for inclusion on SDR, we will contact you to get your permission to upload it to the site.
Happy GIS Day 2015! Now go make a map or go look at some maps!
This can be very useful for analysts, survey planners, and individuals interested in sub-national trends over time.