
Calculate Sample Size using Survey Sampling Online Tools: One Sample

If you’ve watched this video on The DHS Program sampling procedures, you’re aware that calculating a sample size is based on many considerations. Samplers must balance data quality concerns, capacity of the implementing agency, and precision required with available funding and time for the survey. Getting the sample size right is important because “if you don’t know how many households to sample, you don’t know how long the survey is going to take or how much it’s going to cost” explains Justin Fisher, International Survey Sampling Statistician at The DHS Program.
How is the sample size computed? Without getting into complex formulas, data users can quickly and easily calculate a sample size using two sample size calculators developed by Ruilin Ren, Senior Sampling Coordinator at The DHS Program. This blog post describes the first calculator used for sample size determination when estimating a proportion and/or for detecting a change to a known proportion, known as “one sample” hypothesis testing.
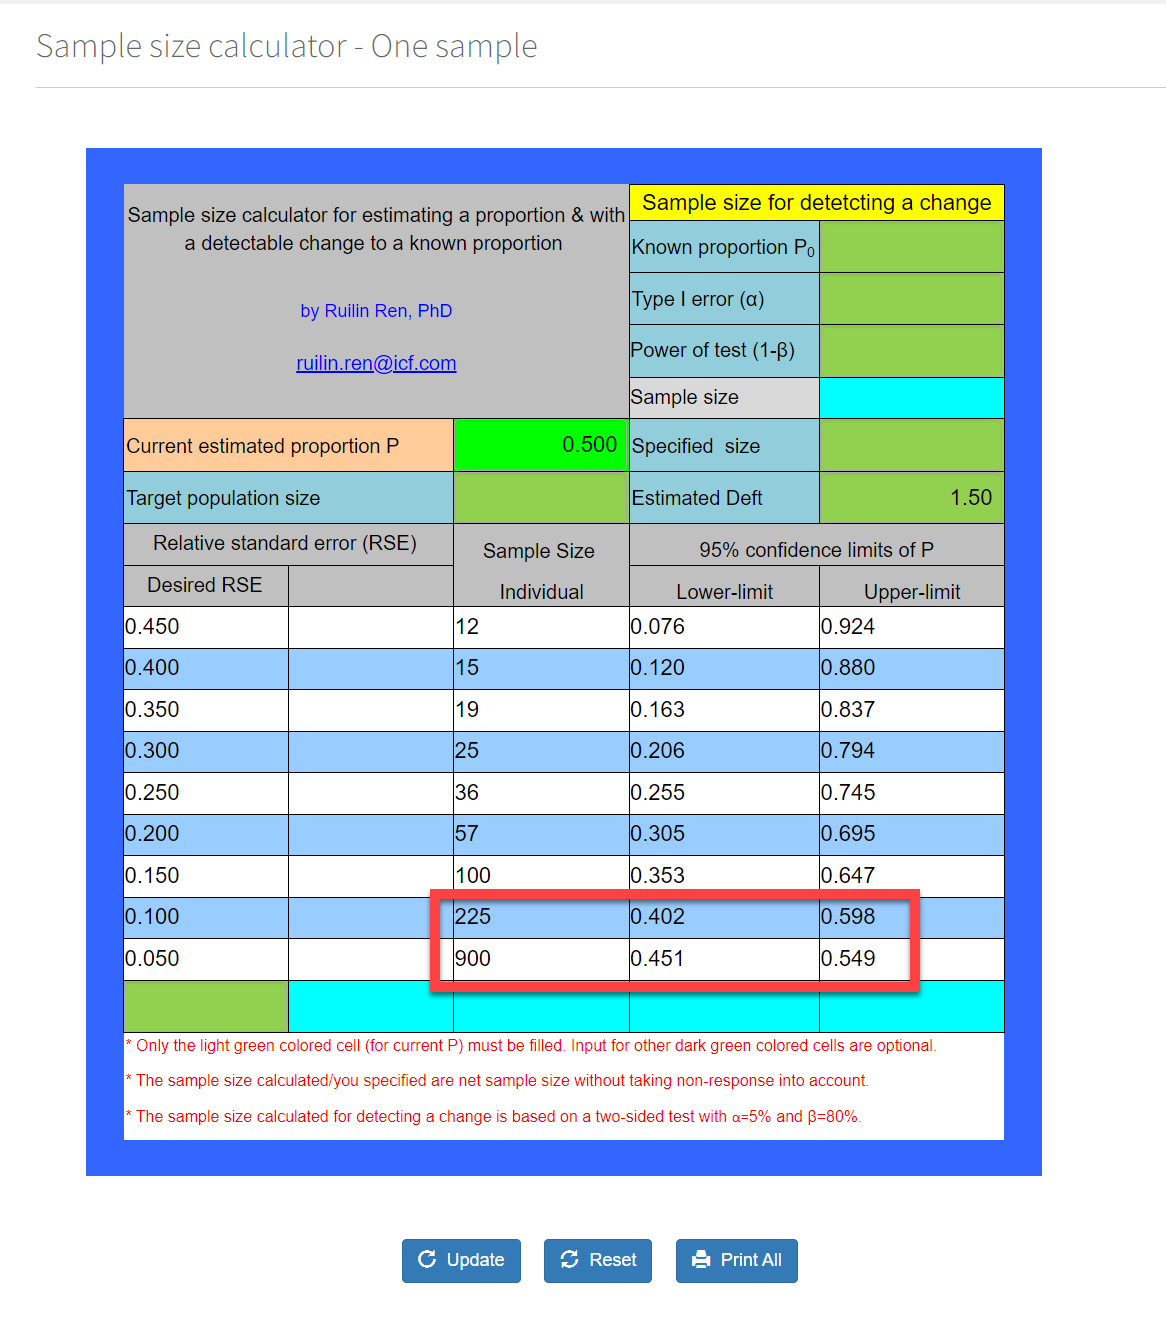
Let’s say you guess that half of the married women in your target population own a mobile phone, your indicator of interest. Fill in 0.5 in the light green cell for current estimated proportion and clear the upper-right cell for known proportion.
In the table we see that a sample size of 225 returns a confidence interval between 0.402 and 0.598—a margin of error of 10 percentage points. This may not be precise enough for your needs. The last row in the table shows that if you want to cut the margin of error in half to 5 percentage points, the sample size need not be doubled, but quadrupled, to 900 respondents! This is an important finding for survey designers as both costs as well as precision of estimates are considered.
This calculator can also help you see what sample size is needed to determine if an expected proportion in your survey is statistically different from some known proportion. Assume that a recent census found that 60% of women own a mobile phone. Fill in 0.6 in the known proportion in the dark green cell at the upper right. In this case, a sample size of 430 respondents is needed to determine that the two values are statistically different. This is the same concept behind a one-sample hypothesis test, but the calculation is rearranged to solve for the sample size.
The design effect (Deft) is an important parameter for sample size determination when using complex sampling procedures including clustering, stratification, Probability Proportional to Size (PPS) sampling, and multistage sampling. Deft is the ratio of the standard error of the current estimate under current design over the standard error of the same estimate if the survey used simple random sampling. Other users may use Deff, the squared value of Deft. Deft can be calculated from previous surveys. For household-based surveys like DHS Program surveys, which typically use a two-stage stratified PPS cluster sampling with 20 to 30 households per cluster, the average value of Deft is around 1.5. Read the Sampling and Household Listing Manual for more.
The sample size calculator automatically fills in a Deft of 1.5, but all dark green cells are editable. Let’s say for your survey about modern method use, you will be using simple random sampling techniques, so no need for Deft.
Now you only need a sample size of 191 respondents to determine if the indicator value is significantly different from the value of 60% found in the recent census.

As you can see, to use or not use a Deft makes a big difference on the sample size. For multistage cluster surveys, a Deft value must be used or the sample size will be too small to satisfy your precision requirements.
Users can “print all” their calculations in a PDF. There are other advanced features to the sample size calculator such as taking the target population size into account when it is small or overriding the assumed probabilities of type-I errors and power of test. You can also check the expected survey precision and/or power of the test if you have a specified sample size.
If you have questions about these tools or want to share how you’ve used them, post a message on The DHS Program User Forum.
Featured image © Frza studio90/Adobe Stock