
Calculate Sample Size using Survey Sampling Online Tools: Two Samples

Yesterday marked the first day of the 54th session of the United Nations Statistical Commission. Chief statisticians from countries worldwide are gathering to advance better data for better lives. Since 1984, The DHS Program has helped over 90 countries conduct more than 400 surveys that provide nationally representative demographic, health, gender and nutrition data that are publicly available and free to data users worldwide.
This blog post describes the second of two sample size calculators. Read about computing a sample size for one population (such as at the national level) in this previous blog post. A survey’s sample size is one of the first things survey planners need to establish because it affects not only precision of estimates, but other aspects of data collection such as how many interviewers need to be hired and how long they need to be in the field.
The DHS Program has developed a tool for statisticians to use to decide the sample size for testing the statistical significance between two estimated proportions: a “two sample” sample size calculator. This can be helpful when planning for comparing differences between two subpopulations, such as urban and rural dwellers, or for program evaluation at baseline and endline. Let’s consider three scenarios:
Scenario 1
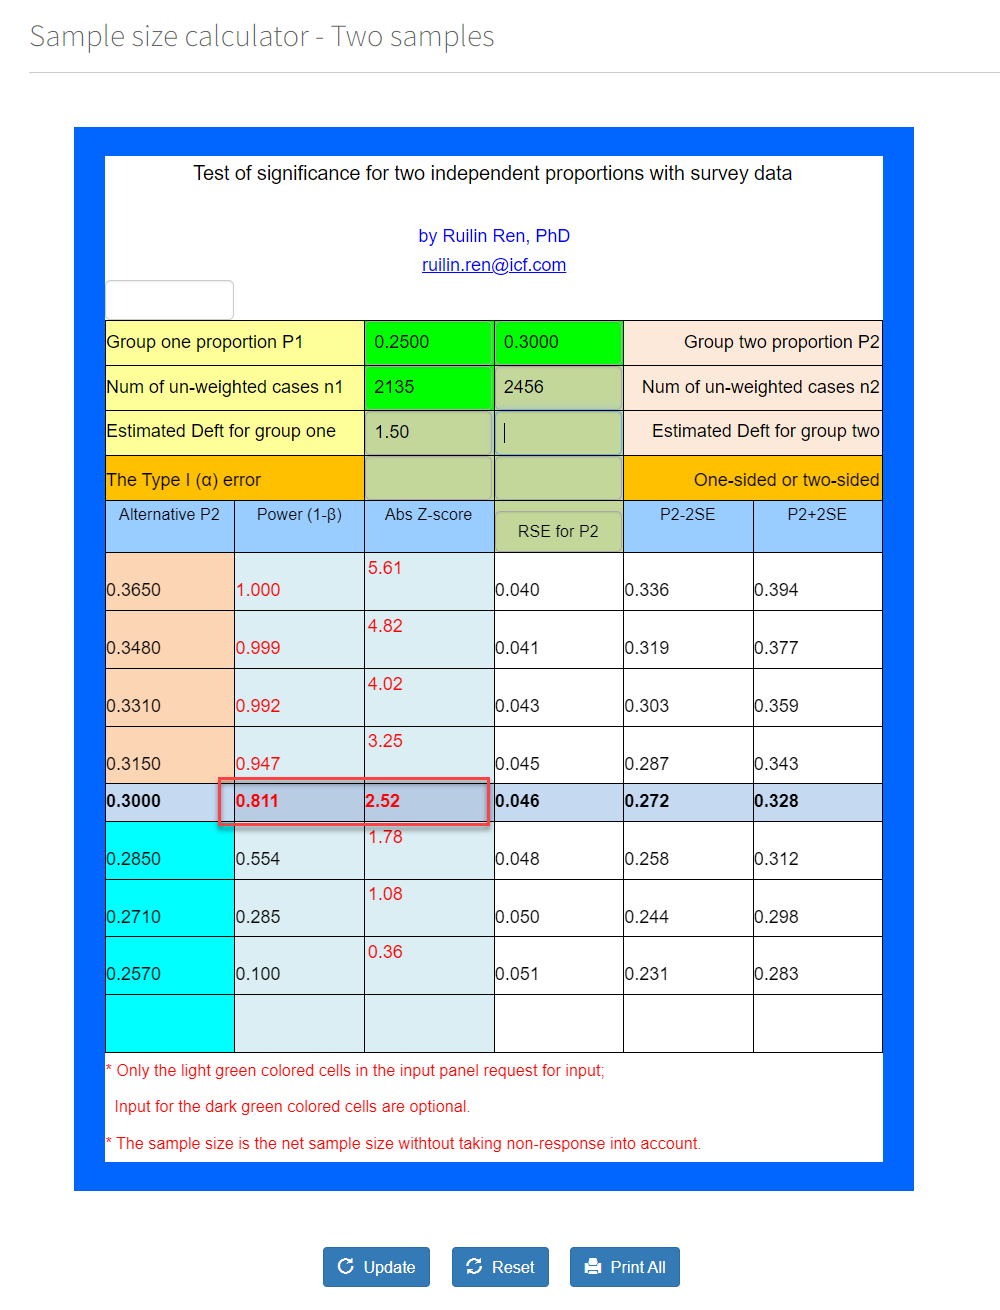
Say we knew an estimated proportion from a prior survey was found to be 25%, and the proportion for the same indicator in a more recent survey is 30%, with sample sizes of 2,135 and 2,456 from the two surveys, respectively. Are these two proportions far enough apart for us to consider them statistically different? By entering the proportions and the sample sizes in the template and assuming a design effect (Deft) of 1.5, we see that the two-sample test gives a Z-score of 2.52 and a power of 81% (see the middle row highlighted in blue), large enough to reject the null hypothesis that the two true population values are the same, that is, the change in the indicator between the two surveys is significant.
Scenario 2
Next, say a recent survey revealed that 35% of women in a particular region are using modern methods of family planning (and thus, you expect a baseline survey will produce the same estimate). Your project aims to increase modern family planning use to 40% by the endline survey. You can use this “two sample” calculator to determine the minimum sample size needed to detect the expected change with at least 80% power. The sample size determination with this template is a try-and-modify process until the expected power is obtained (in the middle row highlighted in blue). By entering a sample size of 1,610 and assuming a design effect Deft of 1.5, we see that while the Z-score of 1.95 is larger than the critical value 1.65 needed for a one-sided test, the power of the test is only 62.1% well below 80%. With a few adjustments, we can see that a sample size of 2,610 for both the baseline and endline surveys yields the required 80% power. Using the same sample size in both surveys is the most economic strategy because the total sample size for the two surveys together is minimized. See the next scenario for more details.
Scenario 3
Let’s continue the previous scenario and assume that the baseline survey was conducted with a sample size of 2,000. To detect the expected change with a power of 80%, they will need to do the endline survey with a sample size of 3,700, giving a total sample size for the baseline and endline surveys of 5,700. This is larger than the total sample size of 5,220 (2×2,610) in the previous scenario. If the baseline sample size is not sufficient, you can increase the sample size in the endline survey to reach the expected power of detection, though larger sample sizes are more expensive.
It is critical to use a sufficient sample size at baseline; otherwise you may fail to detect the expected change no matter how large the endline survey sample size is. For example, if you decide to do the baseline survey with a sample size of 1,200 it will be very hard to increase the endline sample size to reach 80% power. Even with a sample size of 50,000, the power of detecting the expected change is only 76.5%.
If you have questions about these tools or want to share how you’ve used them, post a message on The DHS Program User Forum.
The DHS Program is committed to strengthening statistical capacity worldwide. Since 2017 The DHS Program has offered an eight-week Survey Sampling Training virtual instructor-led eLearning course in French and English. Overall, 259 women and 562 men from countries worldwide have completed the course and applied the skills they gained to several health-related surveys. The Survey Sampling Training Course will next be offered in English online in summer 2023. Follow The DHS Program on Facebook, LinkedIn, and/or Twitter for updates.