Making over the DHS Final Report: Formal and Academic to Colorful and User-Friendly
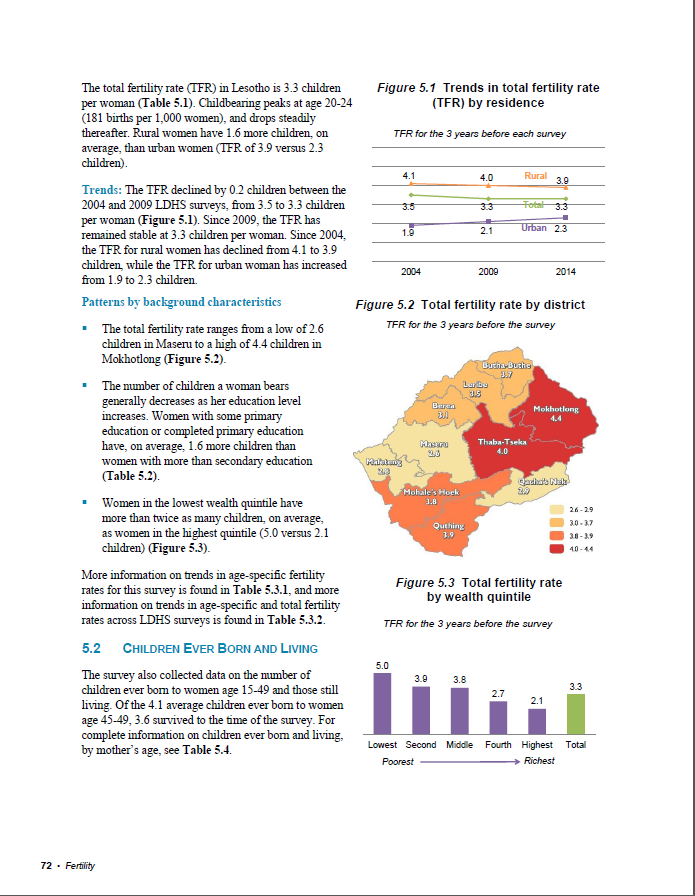
Have you seen the new DHS Final Report style? In June, the 2014 Lesotho DHS was published and is the first report to try out our new format featuring color graphics, maps, bulleted text, and standard indicator definition boxes.
While minor formatting and style changes have been introduced over the past 30 years, the DHS Final Report of 2013 looked much as it did in the 1990s. In 2013, a more dramatic change was proposed: to create a more modern and user-friendly report. In 2015, the Lesotho Ministry of Health (MOH) 2014 DHS team agreed to be the first survey to utilize the new DHS final report style.
I had the pleasure of being in the capital city of Maseru to collect feedback on the new style. I met with the report authors from the MOH, academics, program managers, donors, and UN agencies. The positive response was overwhelming: everyone agreed that the new report was far more accessible, less intimidating, and would lead to better use of DHS data to inform decision making.

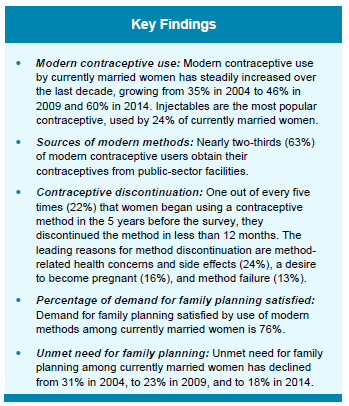
Each chapter is introduced by a box of key findings, highlighted key trends, and patterns in the data
Leutsoa Matsoso, one of the report authors, commented, “This one is easier to get straight to the point. I know the first [LDHS report] from 2004; it was also good, but there was a lot of ingredients before you get to the meat . . . for policy makers, for decision makers, it’s easy to see…Here [in the old report], if you take too long explaining, nobody ends up reading that information.”
Some of the more technical, academic stakeholders had expressed concern that a more user-friendly report might detract from its usefulness for analysts, but the new report style meets the needs of both audiences. So have no fears: all of the DHS tables are still included in this report. Mahlape Ramoseme, Director of the Health Planning and Statistics Department at the MOH explains, “You go [to the tables] if you want more than what is provided here [in the text], but the key findings give you what’s important . . . Even the color, it catches the eye, you really want to read it. It’s not too intimidating.”
Ultimately, the goal of The DHS Program is to provide assistance in the collection and use of data. The 2014 LDHS data are already being used by the highest levels of government. Mr. Matsoso credits the new report style with increasing ownership and use in Lesotho: “Now that Parliament has taken notice of the LDHS, and now that they themselves can see the trends and patterns without having to interpret tables, they will say, ‘we want to fund that because we want to know what is really happening.’ They will see the impact.”
And it sounds like the effects of the report change will carry beyond even the DHS in Lesotho. Matsoso reported, “It was also capacity building for us, because we are used to writing reports but we normally do it in the narrative way. This one we had to critically talk to the tables, talk to the data, try to find trends…This was very positive for us, because now when we prepare reports we will focus on the critical points.”
Many of the upcoming DHS surveys will be utilizing this new format piloted in Lesotho. The DHS Program is still collecting feedback on the new Final Report style, and will incorporate comments into subsequent versions. So explore the report today! If you have feedback, please email Erica Nybro at Erica.Nybro@icfi.com.


