
The Evolution of The DHS Program Tableau Dashboard
2022 marks the 50th anniversary of the start of the World Fertility Survey (WFS). USAID created The Demographic and Health Surveys (DHS) Program in 1984 as a follow-on project to the WFS. To visualize the history and impact of 50 years of USAID’s dedication to high-quality data collection, evidence-based decision making, and host-country ownership, The DHS Program is pleased to launch a new dashboard. Click through interactive visualizations to learn about the Evolution of The DHS Program.
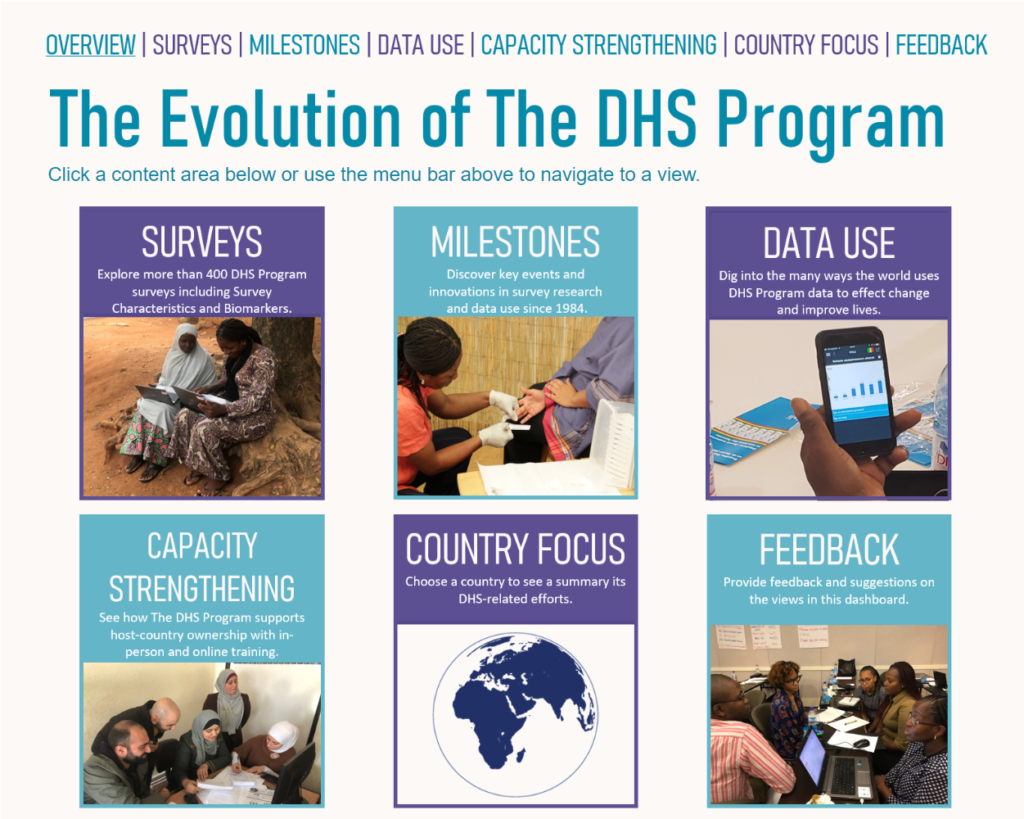
Navigate to Surveys, Milestones, Data Use, Capacity Strengthening, and Country Focus content areas from the Overview and by using the menu bar across the top. Users can also provide feedback on the Evolution of The DHS Program Tableau dashboard.
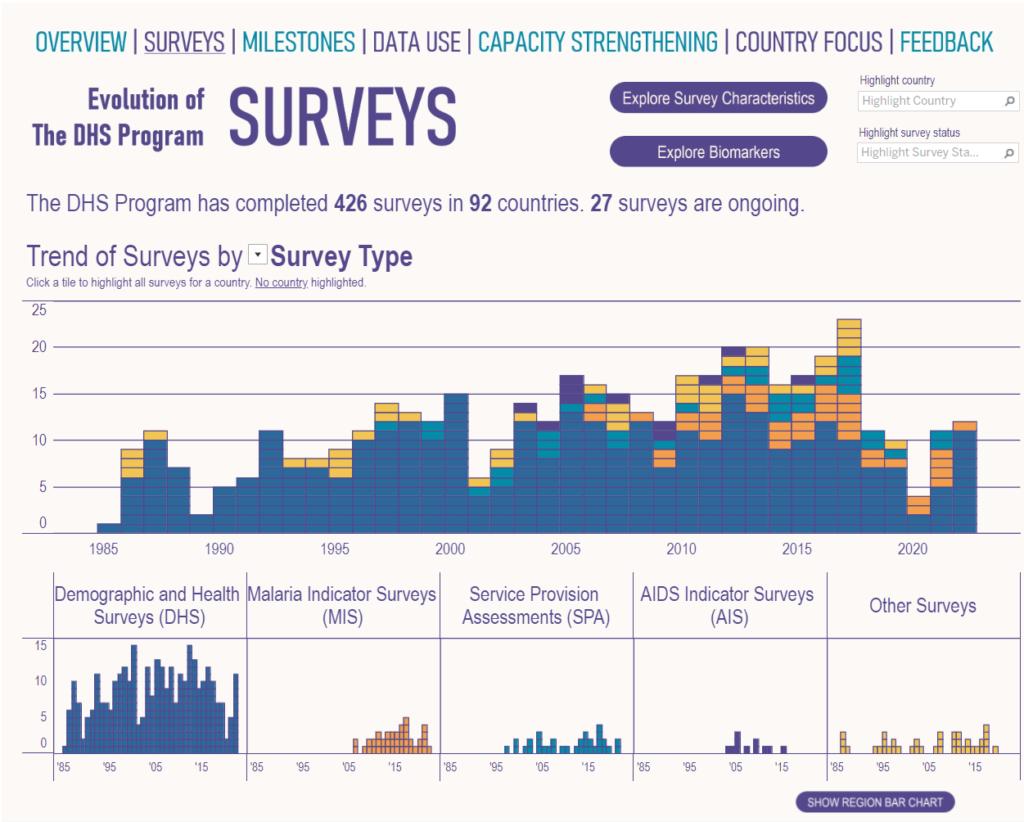
Click on Surveys to explore trends in surveys over time by survey type (e.g., DHS, MIS, SPA), region, and status (completed and ongoing). Click on any brick for more information about a particular survey. Clicking ‘Show region bar chart’ at the bottom right reveals a bar chart of DHS Program surveys conducted by region.
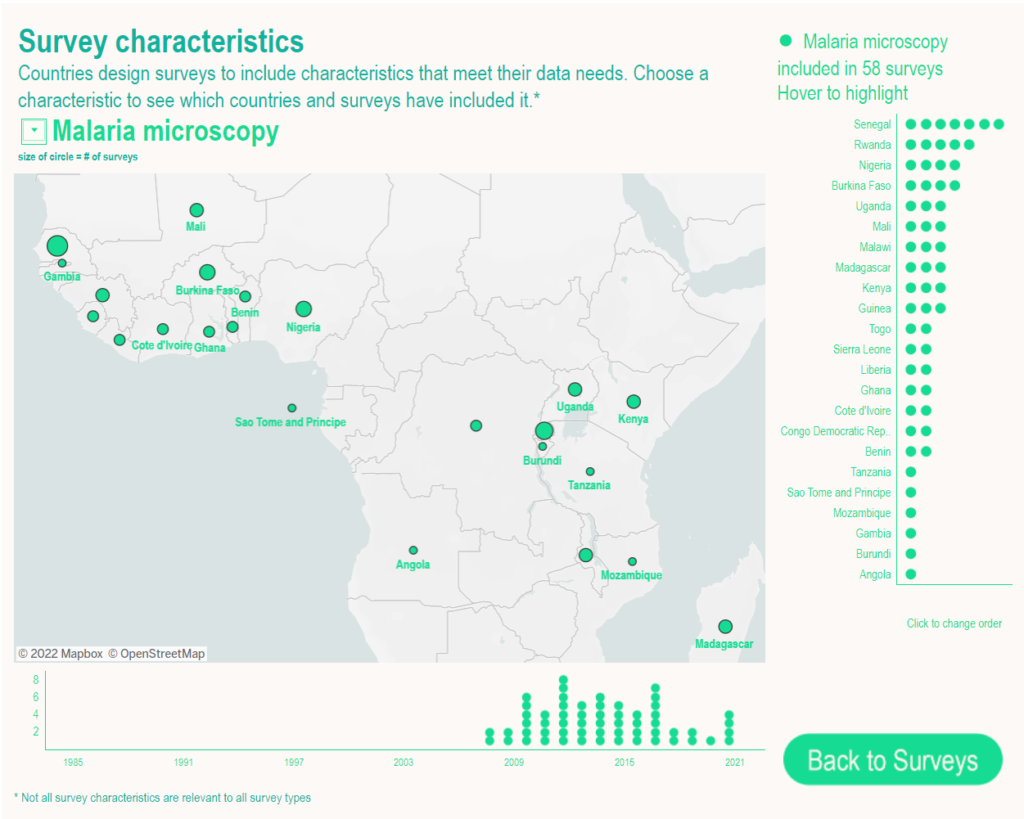
On the Surveys view, click ‘Explore Survey Characteristics’ at the top right to see a map of which surveys included a selected survey characteristic.
On the Surveys view, users can click ‘Explore Biomarkers’ to see the biomarkers collected in different DHS Program surveys.
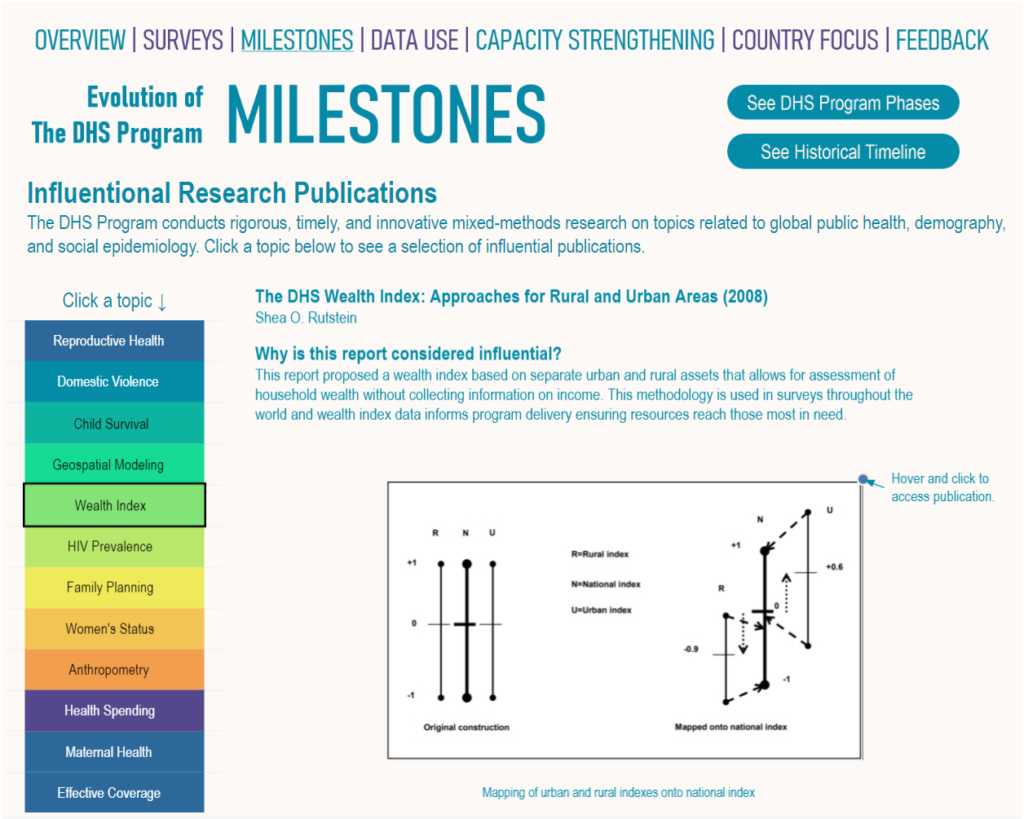
On the Milestones view, explore influential research publications from The DHS Program that have made important contributions to demography and global health, as well as a timeline of The DHS Program phases and a historical timeline of USAID-supported population and health surveys.
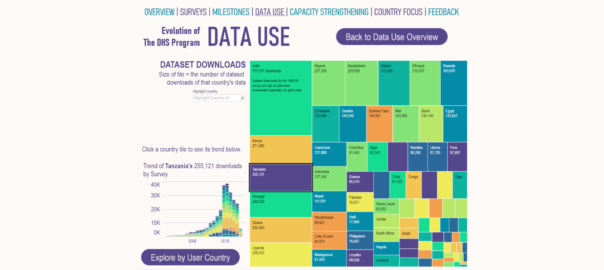
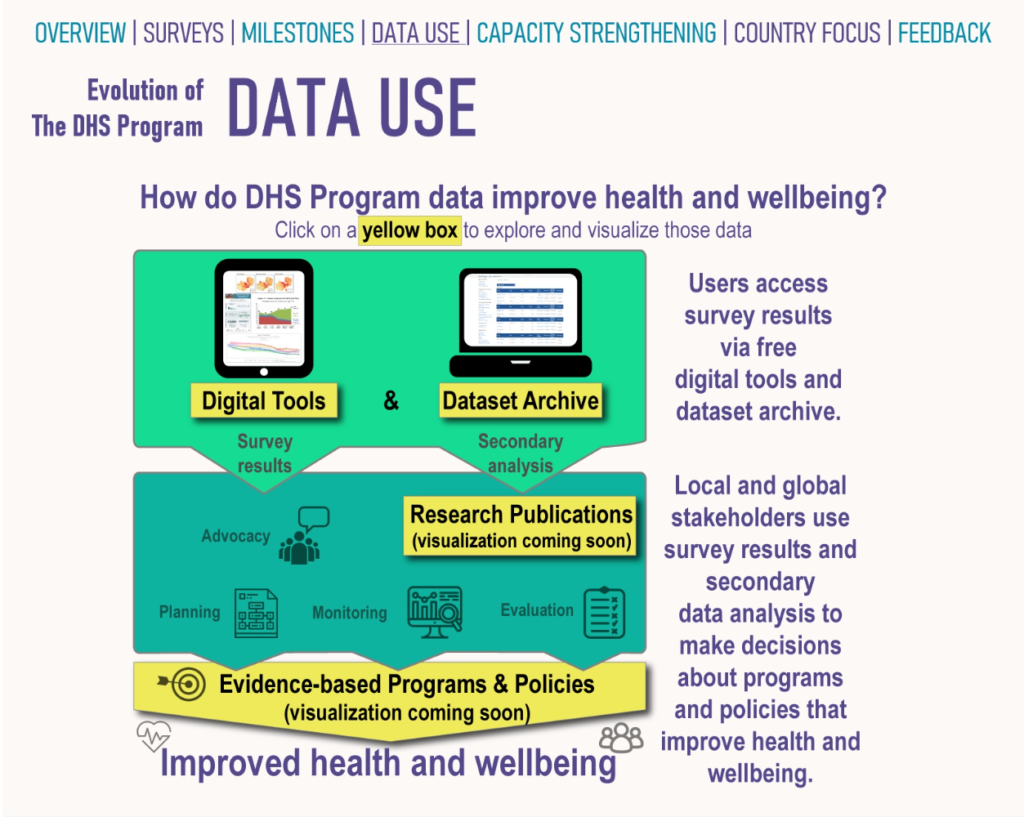
DHS Program data are agents for change. On the Data Use view, explore the use of DHS Program digital tools and the number of datasets downloaded and dataset users by clicking on the yellow boxes.
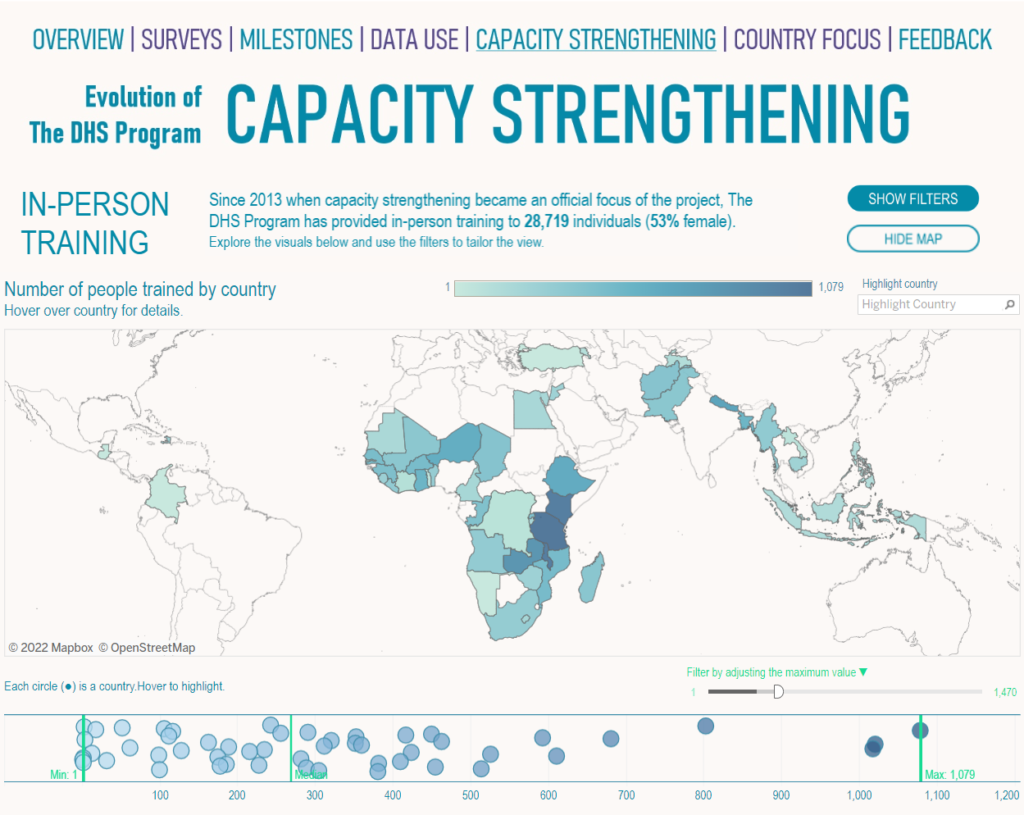
Click Capacity Strengthening to see the number of people who have participated in in-person and online trainings from The DHS Program. Finally, the Country Focus view allows users to view a summary of key data from the other views for a selected country.
Watch this space: additional views of the Evolution of The DHS Program Tableau Dashboard visualizing important milestones, research publications, and evidence-based programs and policies are coming soon!
Are you inspired by these visualizations? Do you have a creative way of visualizing World Fertility Survey or DHS data? Submit your visualization using WFS or DHS data and you may be featured in the data visualization showcase!
If you are attending the PAA 2022 Annual Meeting this week, be sure to visit The DHS Program at Booth #6 for free publications, tours of our web and mobile tools, and access to DHS Program experts.