Lower Fertility Rates Key to Slower Population Growth

Between 1970 and 2020, population growth slowed, and the world median age went up. This was due more to decreased fertility than declines in mortality. In some regions of the world, migration also played a factor.
A new paper from The DHS Program examines data from the 2019 revision of World Population Prospects* to determine the relative importance of fertility, mortality, and migration for changes in population size and median age from 1970 to 2020 globally, in 8 major regions under the framework of the Sustainable Development Goals (SDGs), and 12 subregions.
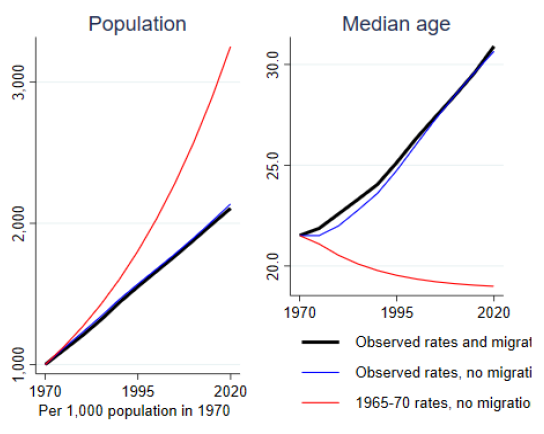
If world fertility and mortality rates observed in 1965-70 had continued through 2020, the world’s population would have more than tripled, from 3.7 billion in 1970 to over 11 billion in 2020. However, the observed population is well below this, estimated at nearly 7.8 billion in 2020.
The median age of a population (the age that divides the population in half, so that half the people are younger, and the other half of the population are older than this age) is a useful summary of the age distribution of a population. If 1965-70 fertility and mortality rates had continued unchanged, the world median age would have declined. Instead, a substantial and steady increase in median age was observed, from 21.2 in 1970 to 30.7 in 2020.
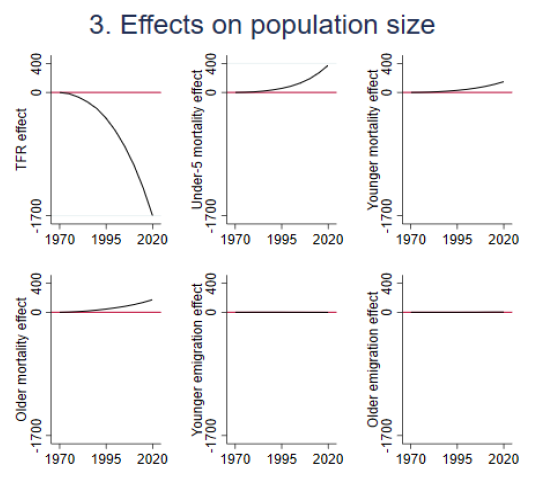
To explore why population is lower and median age is higher than would be expected, the authors created a model of six additive components including total fertility rate (TFR), child mortality (under-5), younger mortality, older mortality, and younger and older net migration. They used the United Nations estimates of the total fertility rate (TFR), which globally declined by half, from 4.93 in 1965-70 to 2.47 in 2015-20. Fertility decline had the greatest effect on reducing population growth. Mortality rates also declined, with an opposite but smaller effect on population size.
Fertility declines also had the greatest effect on increasing median age worldwide.
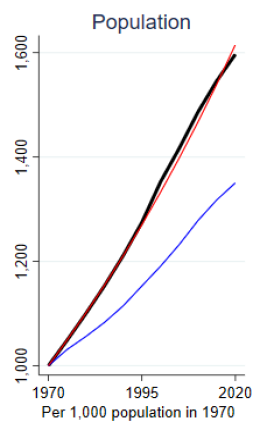
The authors explored the effect of migration on population size and median age by estimating net migration from a residual for major regions and subregions, as there is no actual migration at the global level. For instance, Australia and New Zealand and Northern America (Canada and the United States) had populations in 2020 that were almost exactly what would have been expected based on 1965-70 rates and no immigration. This is because while fertility and mortality rates declined, net in-migration to these regions almost completely offset these effects.
This paper explores the demographic factors that contributed to population reduction over the last half-century. Understanding the drivers of change in population age structure will help policymakers make investments best suited to our changing world, including in mortality reductions, family planning programs, climate mitigation efforts, migration policies, and more.
Download and read A Decomposition of Sources of Change in Population Size and Median Age, 1970-2020 and a supplement which provides graphical detail for 204 additional countries and regions.
The authors will present a poster, “Policy Interpretations of the Global Effect of Fertility Decline on Population Size and Median Age, 1970-2020” at the upcoming Population Association of America (PAA) 2022 Annual Meeting during Poster Session P3: Fertility, Family Planning, Sexual Behavior, and Reproductive Health on Thursday, April 7, 2022 from 2:30-4:00pm EST.
If you plan to attend the PAA 2022 Annual Meeting, be sure to visit The DHS Program at Booth #6 for free publications, tours of our web and mobile tools, and access to DHS Program experts.
*The 2019 revision of the World Population Prospects from the Population Division of the United Nations is based on data from 1,690 population and housing censuses conducted between 1950 and 2018, vital registration systems for 163 countries, and demographic indicators from 2,700 surveys, including 321 Demographic and Health Surveys and 44 World Fertility Surveys.
Featured image by © elenabsl, stock.adobe.com


